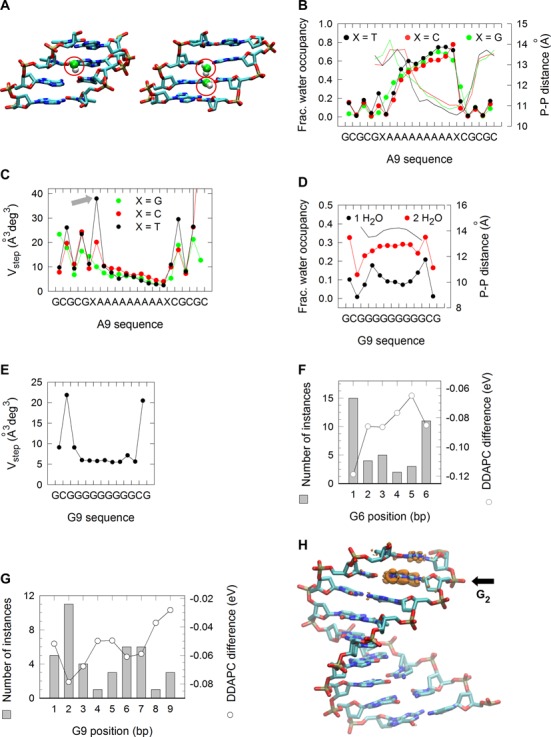
Figure 4.

MD and QM/MM simulations. (A) Molecular modeling of one (left) and two (right) minor groove water bridge coordination. (B) Fraction of one-water bridge occupancy (left axis) at A[9] DNA sequences flanked 5′ and 3′ by a T (black circles), C (red circles) or G (green circles). Minor groove widths (right axis), as determined from intrastrand phosphate-to-phosphate distances. (C) Vstep for A[9] DNA sequences, determined as the product of the square root of the eigenvalues (λi) described by the six bp step parameters shift, slide, rise, tilt, roll and twist; i.e.  . (D) Fraction of one- (black circles) and two-water (red circles) bridge occupancy (left axis) at G[9] DNA sequences. Minor groove widths (right axis), as assessed from intrastrand phosphate-to-phosphate distances. (E) Vstep for G9 DNA sequences. (F) Average charge redistribution (open circles and right axis) for G[6] DNA structures upon vertical ionization, examined by calculating the difference on the density-derived atomic partial charges (DDAPC) for the neutral and negatively charged states. Histogram of the number of instances (left axis) in which the largest charge redistribution occurred at a specific position along the G[6] structures. (G) DDAPC for G[9] DNA structures (open circles and right axis) and histogram of the number of instances (left axis) in which the largest charge redistribution occurred at a specific position. (H) VMD rendering of a G[9] DNA structure displaying hole localization at G2. Capped base pairs were removed for clarity.
