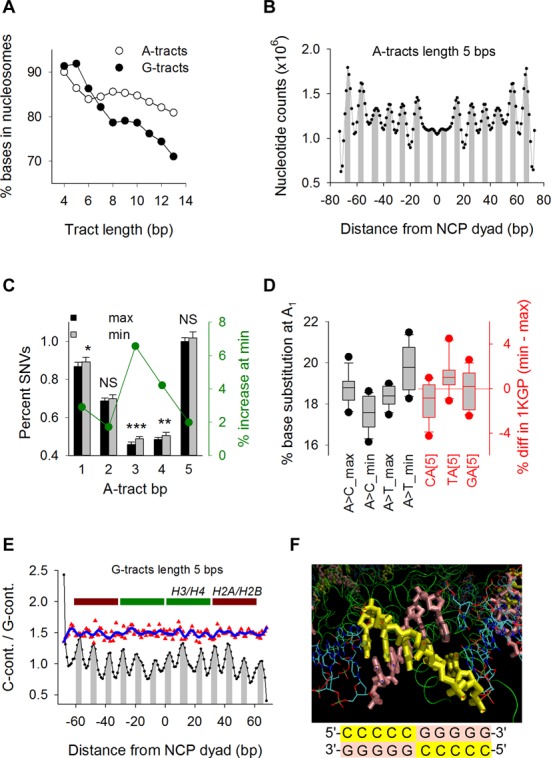
Figure 5.

Positioning along nucleosome core particles. (A) Percent of A-tract (open circles) and G-tract (closed circles) base pairs in hg19 overlapping with well-positioned NCP genomic coordinates as a function of tract length. (B) Counts of base pairs in hg19 A-tracts of length 5 overlapping with NCPs genomic regions as a function of distance from the histone octamer dyad axis. Minor groove-inward-facing regions (gray) were derived from the X-ray crystal structure of NCP147 (41). (C) Percent SNVs in the 1KGP dataset (left axis) at every bp along A-tracts of length 5 for tracts centered at maxima (black) and minima (gray) along NCPs (Figure 5B). Percent increase (right axis) of SNVs at minima relative to maxima (green). P-values for paired t-tests: 0.013 (*), 0.002 (**) and 4.7 × 10⁻⁶ (***). (D) Whisker plots of%SNVs (left axis) at A1 for A-tracts of length 5 centered at maxima and minima (black) along NCPs (Figure 5B). Percent difference (right axis) in the number of A-tracts of length 5 in hg19 preceded by C, T or G (red) between those centered at minima and those centered at maxima (Figure 5B). (E) C-containing/G-containing ratios (see text) for G-tracts of length 5 in hg19 as a function of distance from the NCP dyad axis (black) and location of core histones (maroon and green). Peaks correspond to negative iSAT (i.e. tilt parameters multiplied by the corresponding sin θ) values (gray) (39). Ratios of%SNV at G1 (upshifted by 0.5 for clarity) between C-containing (5′-CCCCCG-3′ sequences on the hg19 forward strand) and G-containing (5′-CGGGGG-3′ sequences on the hg19 forward strand) (Figure 1A) CG[5] tracts mapping NCP Chip-seq genomic intervals (red) fitted by a non-parametric local regression (loess; sampling proportion, 0.100; polynomial degree, 3). (F) VMD rendering (top) of TATTT residues 34–38 (yellow) and the complementary AAATA residues 672–753 (pink) from the 1EQZ pdb nucleosomal crystal structure, corresponding to peak area from −40 to −36 in Figure 5E. The switch in G-tract (lengths of 5 and 7) orientation along NCPs (bottom) serves to position the C-containing strand on the outside (yellow) and, correspondingly, the G-containing strand on the inside (pink).
