
Figure 1.
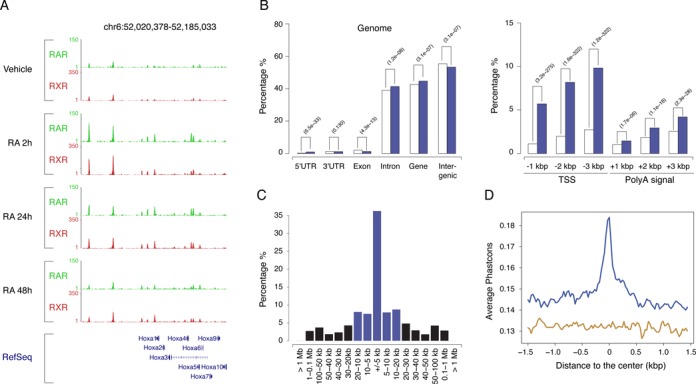
RAR/RXR heterodimers binding regions. (A) Time course analysis of RAR (green) and RXR (red) binding profiles in the Hoxa locus after RA stimulation of F9 EC cells. A screenshot (http://genome.ucsc.edu) of the RAR and RXR binding signal at the different time points after RA stimulation, is shown. (B) Characterization of RAR/RXR binding region relative to specific genomics features. Open and blue bars show the proportion of the indicated genomics features in the genome and ChIP regions, respectively. (C) Distribution of the distance to the first annotated transcription start site (TSS) (blue bars: absolute distance < 20 kb, black bars: absolute distance > 20 kb). (D) Multiple species alignment scores (Phastcons) for RAR/RXR binding regions (blue curve) and randomly selected genome regions (brown curve).