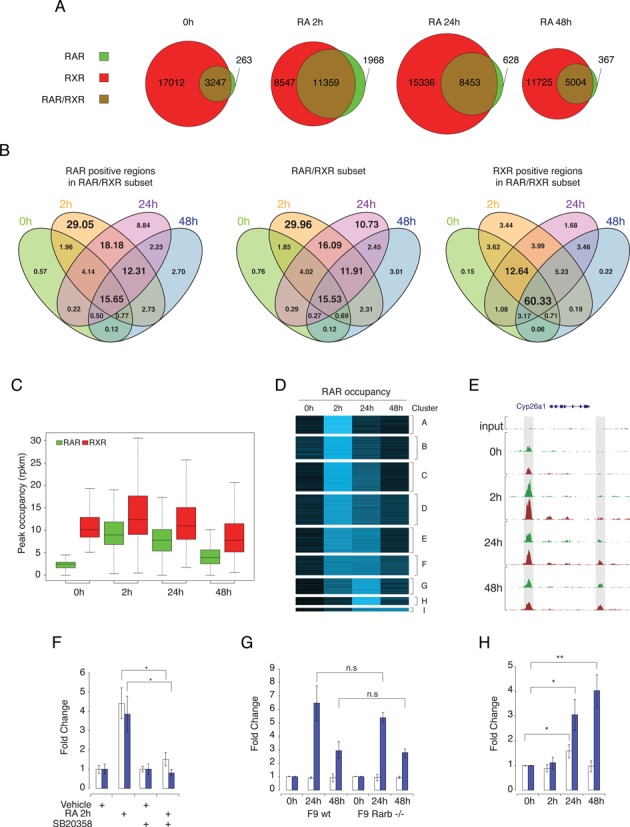
Figure 2.

RAR and RXR binding dynamics in differentiating F9 EC cells. (A) The number of RAR- and RXR-binding sites detected by ChIP-seq during PrE differentiation. Results are shown as Venn diagrams representing the number of binding sites during differentiation for RAR only (green), RXR only (red) and shared RAR/RXR (brown). Circle sizes are representative of the number of binding sites at the indicated time point. (B) Intersection of RAR, RXR and RAR/RXR binding regions occupation throughout the PrE differentiation process. Results are shown as four-way Venn diagrams representing the proportion (%) of binding sites assigned to specific temporal behavior in each sub-category. (C) Distribution of the occupancy level over time for binding sites exhibiting no binding of RAR (green) and significant binding of RXR (red) in untreated condition. Occupancy levels are expressed in read per region and per million mapped reads. (D) K-means clustering of RAR/RXR dynamic regions based on their changes in RAR occupancy during PRE differentiation. Results are shown as heat map representing the normalized RAR binding region coverage intensity over time. (E) RAR (green) and RXR (red) binding profiles variation in the Cyp26a1 locus after RA stimulation of F9 EC cells. Upstream and downstream binding region are highlighted by gray box. (F) qPCR quantification of RAR binding intensity at the Cyp26a1 upstream (open bars) and downstream (blue bars) binding sites. RAR binding intensity was normalized on binding level in untreated cells for each binding region. The data shown represent mean ± SD of triplicate experiments. Student's t-test was applied to assess statistical difference of the mean (*: P < 0.05; **: P < 0.01). (G) qPCR quantification for temporal binding pattern of RAR at Cyp26a1 upstream (open bars) and downstream (blue bars) binding sites in wild-type (WT) and Rarb -/- F9 cells. Statistical analysis similar to (F). (H) qPCR quantification of temporal open chromatin enrichment at Cyp26a1 upstream (open bars) and downstream (blue bars) RAR/RXR binding sites. Results show open chromatin enrichment in RA-stimulated relative to untreated F9 EC cells. Statistical analysis similar to (F).
