
Figure 5.
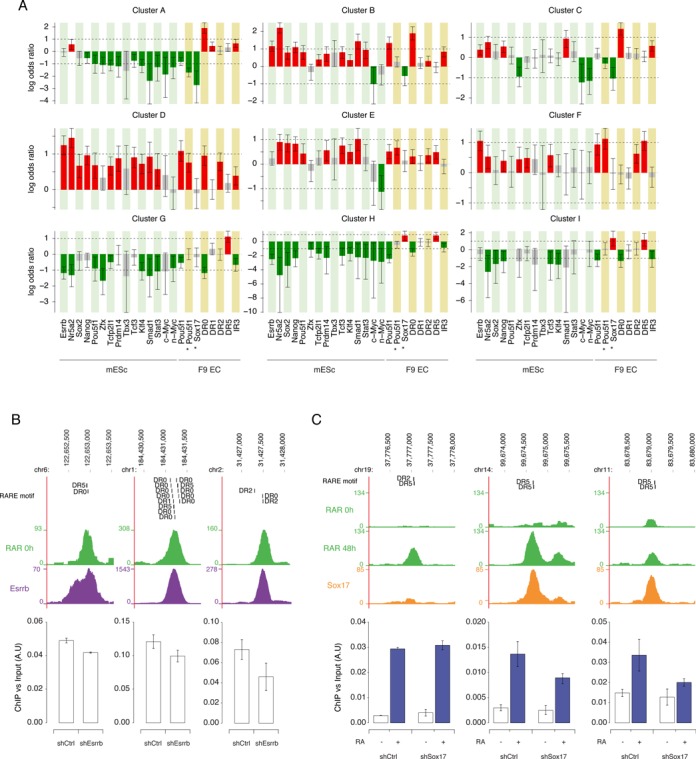
RAR/RXR binding dynamics and region-associated features. (A) Each bar represents the log odds ratio from Fisher's exact test between a cluster assignment and the presence of a feature within 0.5kb of the RAR/RXR peak summit. A red (resp. green) bar indicates that a feature is significantly more frequent (resp. less frequent) in the cluster than in other RAR/RXR binding regions. Error bars indicate 95% confidence intervals. (B) Effect of Esrrb KD on RAR binding intensity. Upper panels show a screenshot (http://genome.ucsc.edu) of RAR and ESRRB binding signal on the genomic loci analyzed in wild-type F9 cells and ES cells respectively. Predicted RARE motifs present under the peak are indicated. Lower panels show ChIP-qPCR quantification of RAR binding in Control and Esrrb KD F9 cells. RAR binding intensity is expressed relative to input amount. The data shown represent mean ± SD of replicate experiments. (C) Effect of Sox17 KD on RAR binding intensity. Upper panels show a screenshot (http://genome.ucsc.edu) of RAR and SOX17 binding signal on the genomic loci analyzed in untreated and RA treated wild-type F9 cells. Predicted RARE motifs present under the peak are indicated. Lower panels show ChIP-qPCR quantification of RAR binding in untreated and RA treated Control and Sox17 KD F9 cells. RAR binding intensity is expressed relative to input amount. The data shown represent mean ± SD of replicate experiments.