Figure 6.

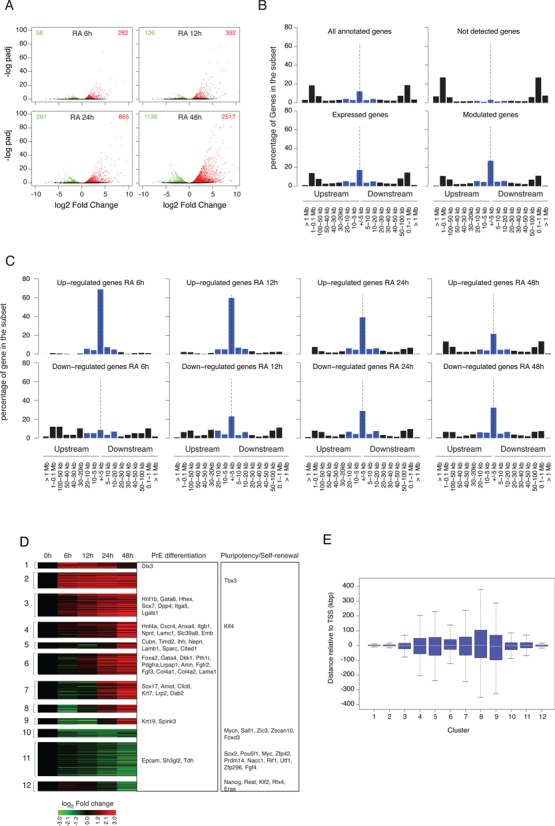
Gene expression profiles during RA-induced PrE differentiation of mouse F9 EC cells. (A) Identification of differentially expressed genes at different time points after RA stimulation relative to their untreated expression level. Results are shown as a volcano plot representing Benjamini-Hochberg adjusted P-value versus log2 fold change on the y- and x-axes, respectively. Up- and down-regulated genes are shown in red and green, respectively. (B) Proportion of genes in the indicated set that exhibit an RAR/RXR target regions within the indicated distance range from their closest annotated TSS. Blue bars correspond to the percentage of genes exhibiting an RAR/RXR target region at less than 20 kb upstream or downstream of their annotated TSS. (C) Same as (B) panel for gene up- or down-regulated at the indicated time point after RA stimulation. (D) Clustering of differentially expressed gene expression profiles. Gene associated to Primitive Endoderm differentiation or pluripotency maintenance are indicated in the corresponding annotated boxes. (E) Boxplot representing the distance distribution of the closest RAR/RXR target region relative to annotated TSS of differentially expressed genes for the previously defined (D) expression clusters.
