
Figure 7.
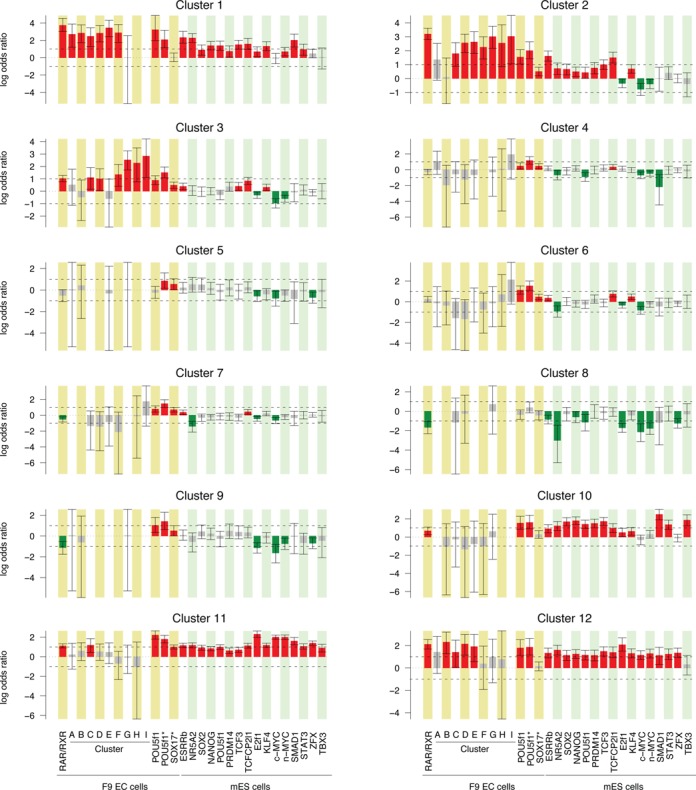
Gene expression profiles and associated regulatory region features. The results are shown as the association score between specific gene expression cluster assignment and presence of the indicated feature within a 40 kb window centered on the annotated TSS. Each bar represents the enrichment of the indicated feature in each cluster with respect to all differentially expressed genes and represents the log odds ratio and 95% confidence interval as computed by Fisher's exact test. The red and green bars correspond to the significantly enriched and depleted features, respectively.