Figure 7.

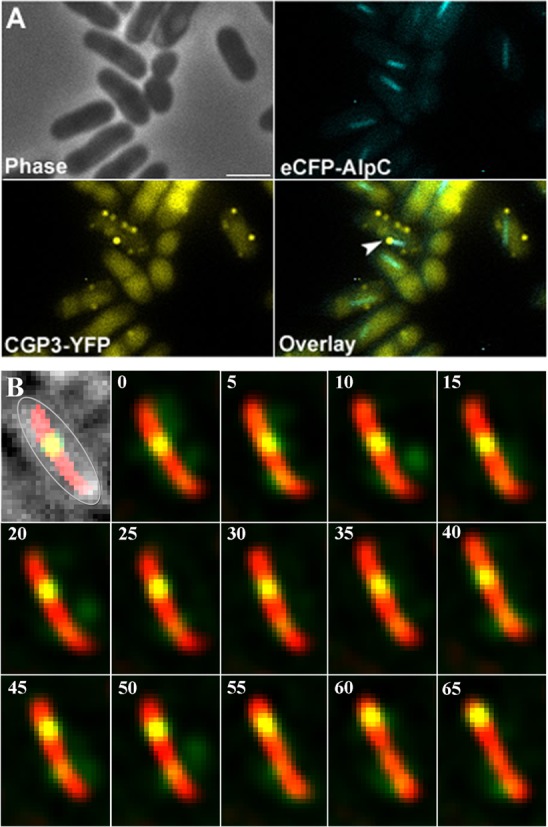
Co-visualization of eCFP-AlpC and induced CGP3 prophage (CGP3- YFP). (A). Cells expressing eCFP-AlpC as a single copy from the native promoter and a YFP labeled CGP3 DNA were treated with mitomycin C for 3 h to induce prophage excision. In the examples shown, the tip of an AlpC filament is connected to a CGP3 phage DNA molecule (arrowheads). (B) Time lapse analysis of AlpA-eYFP and AlpC-mCherry. Cells were treated with mitomycin C prior to microscope analysis. Images were acquired every 5 s for a total of 65 s (as indicated on the upper left corners). The first inset shows an overlay of the phase contrast, yellow and red channels, and the cell is outlined in gray. Within the time frame of the time lapse analysis AlpA-eYFP moves from the midcell region along the AlpC-mCherry filament to the cell pole (see also Movie S6). Scale bar, 2 μm.
