Figure 8.

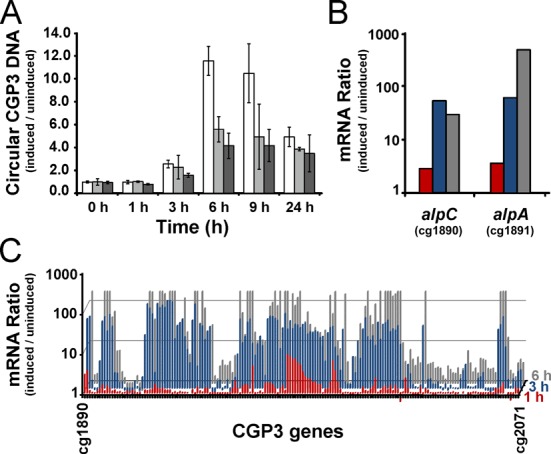
Impact of AlpC on CGP3 replication. (A) The relative amount of circular phage CGP3 DNA was quantified by qPCR in C. glutamicum wild type (white) and ΔalpC (light gray), and ΔalpA (dark gray) upon treatment with 0.6 μM mitomycin C. Shown are average values with standard deviation of three independent biological replicates. (B) Time course of alpC and alpA expression upon prophage induction triggered by the addition of 0.6 μM mitomycin C. Shown is the mRNA ratio of cells treated with mitomycin C versus untreated cells 1 (red), 3 (blue) and 6 h (gray) after mitomycin C addition analyzed by DNA microarrays. (C) Time course of the mRNA ratio of the whole CGP3 gene region after addition of mitomycin C (as described in B).
