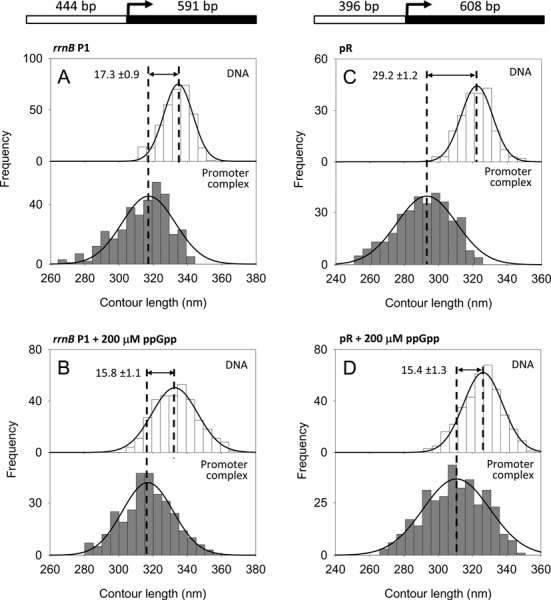
Figure 2.

DNA contour length distributions of bare DNA (top panel) and RPo complexes (bottom panel). (A) rrnB P1 promoter without ppGpp. (B) rrnB P1 promoter with 200 μM ppGpp. (C) λ pR promoter without ppGpp. (D) λ pR promoter with 200 μM ppGpp. The DNA compaction is shown as the difference between the mean values of the fitted Gaussian functions ± SEM. A schematic representation of the DNA templates used is drawn at the top.
