Figure 3.

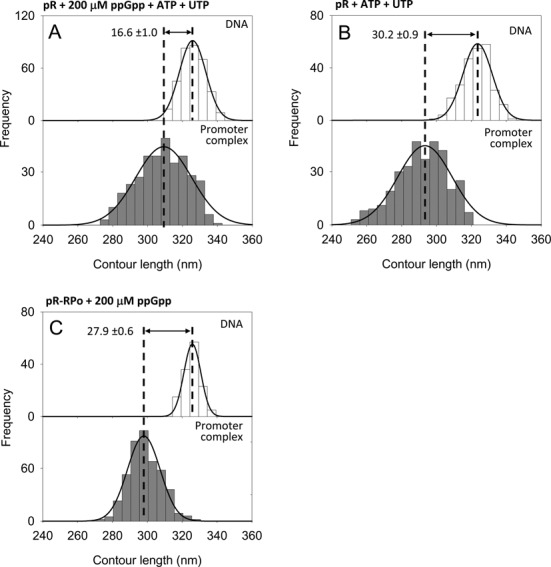
DNA contour length distributions of bare DNA (top panel) and RPo complexes (bottom panel) at the λ pR promoter. (A) With 200 μM ppGpp and 1 mM ATP, 0.1 mM UTP. (B) With 1 mM ATP, 0.1 mM UTP. (C) With 200 μM ppGpp added after RPo formation.

DNA contour length distributions of bare DNA (top panel) and RPo complexes (bottom panel) at the λ pR promoter. (A) With 200 μM ppGpp and 1 mM ATP, 0.1 mM UTP. (B) With 1 mM ATP, 0.1 mM UTP. (C) With 200 μM ppGpp added after RPo formation.