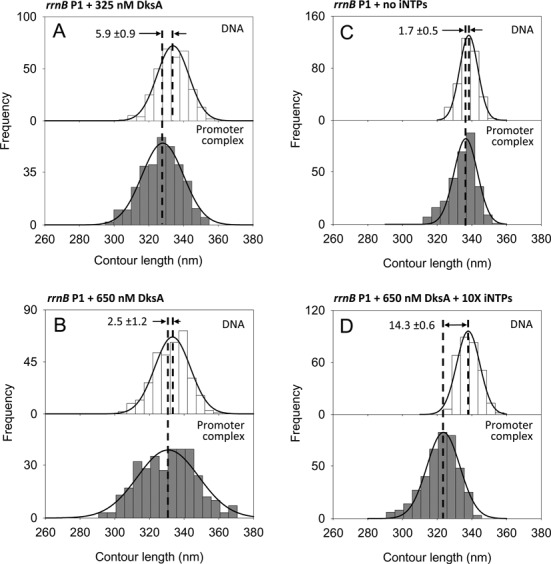
Figure 4.

DNA contour length distributions of bare DNA (top panels) and promoter-bound complexes (bottom panels) assembled onto a 1035 bp long DNA fragment harboring the rrnB P1 promoter under different conditions. (A) 325 nM DksA; (B) 650 nM DksA; (C) without iNTPs; (D) 650 nM DksA, 10 mM ATP and 1 mM CTP.
