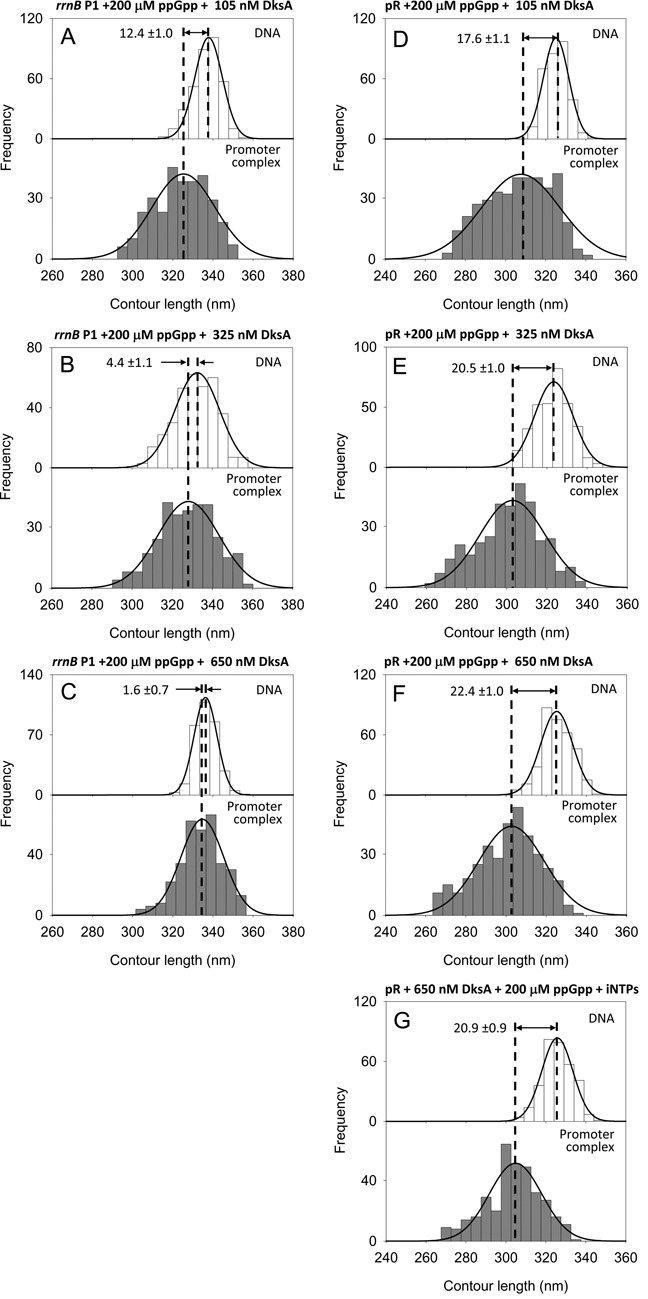
Figure 6.

(A–C) DNA contour length distributions of bare DNA (top panels) and promoter-bound complexes (bottom panels) assembled onto a 1035 bp long DNA fragment harboring the rrnB P1 promoter in the presence of 200 μM ppGpp and increasing concentration of DksA. (D–F) DNA contour length distributions of bare DNA (top panels) and RPo (bottom panels) assembled onto a 1004 bp long DNA fragment harboring the λ pR promoter in the presence of 200 μM ppGpp and increasing concentration of DksA. (A,D) 105 nM DksA; (B,E) 325 nM DksA; (C,F) 650 nM DksA. (G) DNA contour length distributions of bare DNA (top panels) and RPo (bottom panels) assembled at pR with 200 μM ppGpp, 650 nM DksA, 1 mM ATP and 0.1 mM UTP.
