
Figure 6.
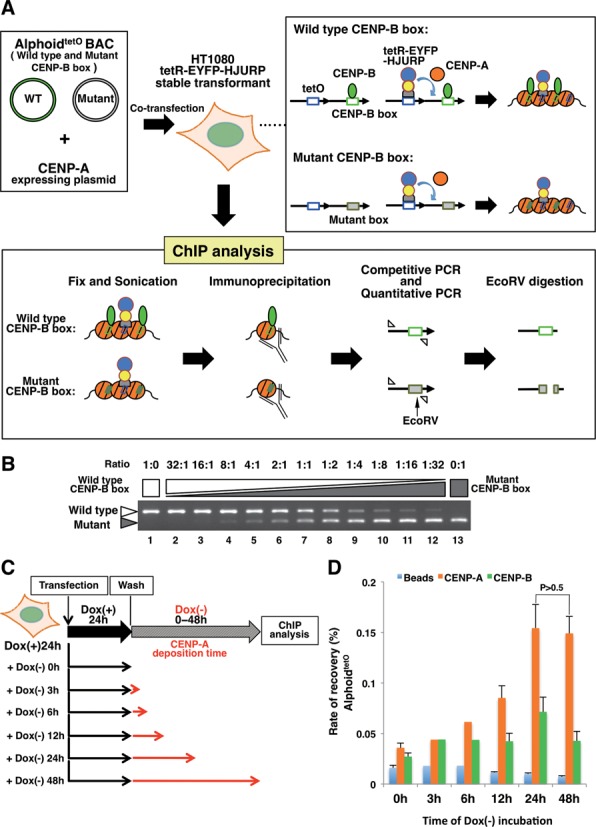
The CENP-A nucleosome preassembly level reaches a maximum after 24h under HJURP tethering conditions. (A) Schematic diagram of the CENP-A nucleosome preassembly and the ChIP real-time PCR/competitive PCR analysis. HT1080 cells stably expressing tetR-EYFP-HJURP were transfected with 50 kb alphoidtetO BAC DNAs and Halo-CENP-A expressing plasmid DNA. To generate CENP-A nucleosome preassembly on the transfected alphoidtetO DNAs by the tethering of tetR-EYFP-HJURP, the cells were cultured in doxycycline-free medium. The CENP-A nucleosome assembly levels were analyzed by a ChIP assay. The DNA samples recovered by ChIP were quantitated by real-time PCR. Then, the PCR products (competitively amplified wild type and mutant CENP-B box alphoidtetO DNAs) were digested with EcoRV and analyzed by agarose gel electrophoresis (43,67). (B) Example of a competitive PCR control. The wild type and mutant CENP-B box alphoidtetO BAC DNAs were mixed at different ratios, and amplified competitively with the same primer set by PCR. The white arrowhead indicates the PCR fragment from the wild type CENP-B box alphoidtetO DNA. The gray arrowhead indicates the PCR fragment from the mutant CENP-B box alphoidtetO DNA. (C) Schematic diagram of the CENP-A deposition and the transient ChIP assay. The cells transfected with the alphoidtetO BAC DNA mixture were cultured with medium containing doxycycline for 24 hr. To analyze CENP-A nucleosome deposition at tetO sites on the transfected alphoidtetO DNAs, the cells were cultured with doxycycline-free medium for 0–48 hr. The ChIP assay was then performed with anti-CENP-A and anti-CENP-B antibodies. The relative copy number of the total alphoidtetO array was quantitated by real-time PCR. The black line indicates the culture with medium containing doxycycline. The red line indicates the culture with doxycycline-free medium. (D) CENP-A preassembly levels on the total alphoidtetO DNAs, determined by the ChIP analysis. The relative copy numbers of the total alphoidtetO array recovered by the beads with the anti-CENP-A antibody or anti-CENP-B antibody, or without antibody, were quantitated by real-time PCR, and are displayed as graphs. Error bars represent the SEM (n = 3). P-values obtained with the t-test are indicated.