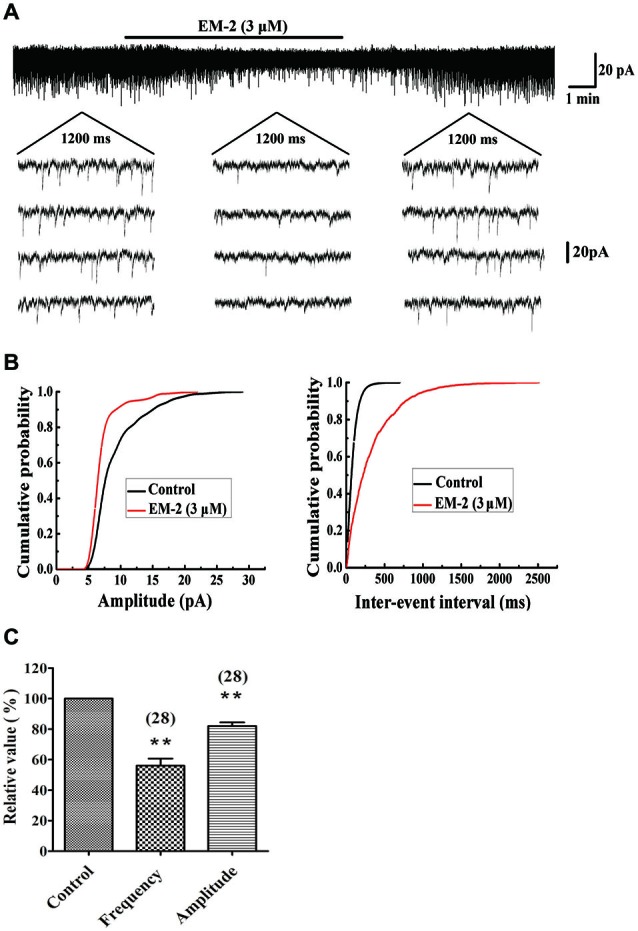
Figure 2.

EM-2 decreased amplitudes and frequencies of sEPSCs in PPNs. (A) Sample traces of sEPSCs in the absence and presence of EM-2. In this and subsequent figures, the duration of drug superfusion is shown by a horizontal bar above the chart recording, and 4 consecutive traces of sEPSCs are shown in the expanded time scales. The period of each trace is 1200 ms. (B) Cumulative distributions of the amplitudes (left) and inter-event intervals (right) of the sEPSC before (black line) and during (red line) the EM-2 applications. EM-2 significantly shifted the mean cumulative distribution of the sEPSC amplitude to lower amplitudes (P < 0.01; Kolmogorov–Smirnov test) and significantly shifted the mean cumulative distribution of the sEPSC inter-event intervals to longer durations (P < 0.01; Kolmogorov–Smirnov test). The data were obtained from the same neuron as in panel (A). (C) Histogram showing that the sEPSC amplitude and frequency were significantly reduced by EM-2 (P < 0.01, paired t-test n = 28). In this and the following figures, the numbers of neurons used to construct each data point are shown in parentheses. The vertical bars show the SDs. **P < 0.01 vs. control. Holding potential = −70 mV.
