Figure 5.

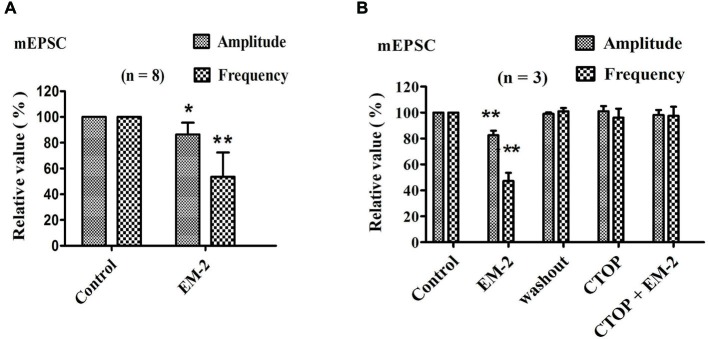
EM-2 reduced the mEPSC amplitude and frequency via the activation of MORs. (A) The effects of EM-2 on the amplitude and frequency of mEPSCs. Histogram showing that the mEPSC amplitude and frequency were significantly reduced by EM-2 (P < 0.05 and P < 0.01 respectively; n = 8). (B) Bar graph showing the analysis of three recordings during which different treatments were performed in three PPNs. EM-2 clearly decreased the amplitudes and frequency of sEPSCs in these 3 PPNs (P < 0.01). After the washout of EM-2, the amplitudes and frequency returned to control levels. CTOP had no effect on either the amplitudes or frequency of mEPSCs (P > 0.05). However, with perfusion of both CTOP and EM-2, EM-2 was unable to decrease the amplitudes or frequency of the sEPSCs (P > 0.05). *P < 0.05, **P < 0.01 vs. control.
