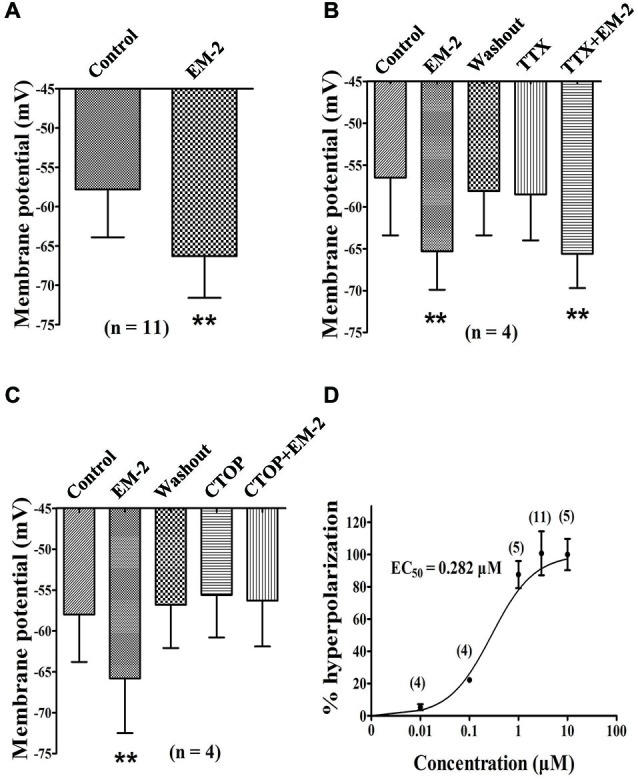
Figure 6.

EM-2 hyperpolarized the RMPs of the PPNs via the activation of MORs. (A) Histogram showing that the average RMPs of the 11 responsive neurons decreased from −57.8 ± 6.1 mV to −66.3 ± 5.3 mV in the presence of EM-2 (P < 0.01, paired t-test n = 11). (B) The effect of TTX on RMPs. Bar graph showing the analysis of four recording during which different treatments were performed in these four PPNs. The RMPs of PPNs were hyperpolarized by EM-2 (P < 0.01). After the washout of EM-2, the RMPs of the recorded PPNs returned to the control levels. TTX alone had no effect on the membrane potential (P > 0.05; n = 4). TTX did not block the EM-2-induced membrane hyperpolarization (P < 0.01). (C) CTOP blocked the action of EM-2 on the RMPs. Bar graph showing the the analysis of four recording during which different treatments were performed in four PPNs. The RMPs were hyperpolarized by EM-2 (P < 0.01). After the washout of EM-2, the membrane potentials of the recorded PPNs returned to control levels. CTOP itself had no effect on membrane potential (P > 0.05). However, EM-2 did not produce membrane hyperpolarization in the presence of CTOP (P > 0.05). (D) Dose-response curve of the hyperpolarization of the PPNs by EM-2. The EC50 value was 0.282 μM. **P < 0.01.
