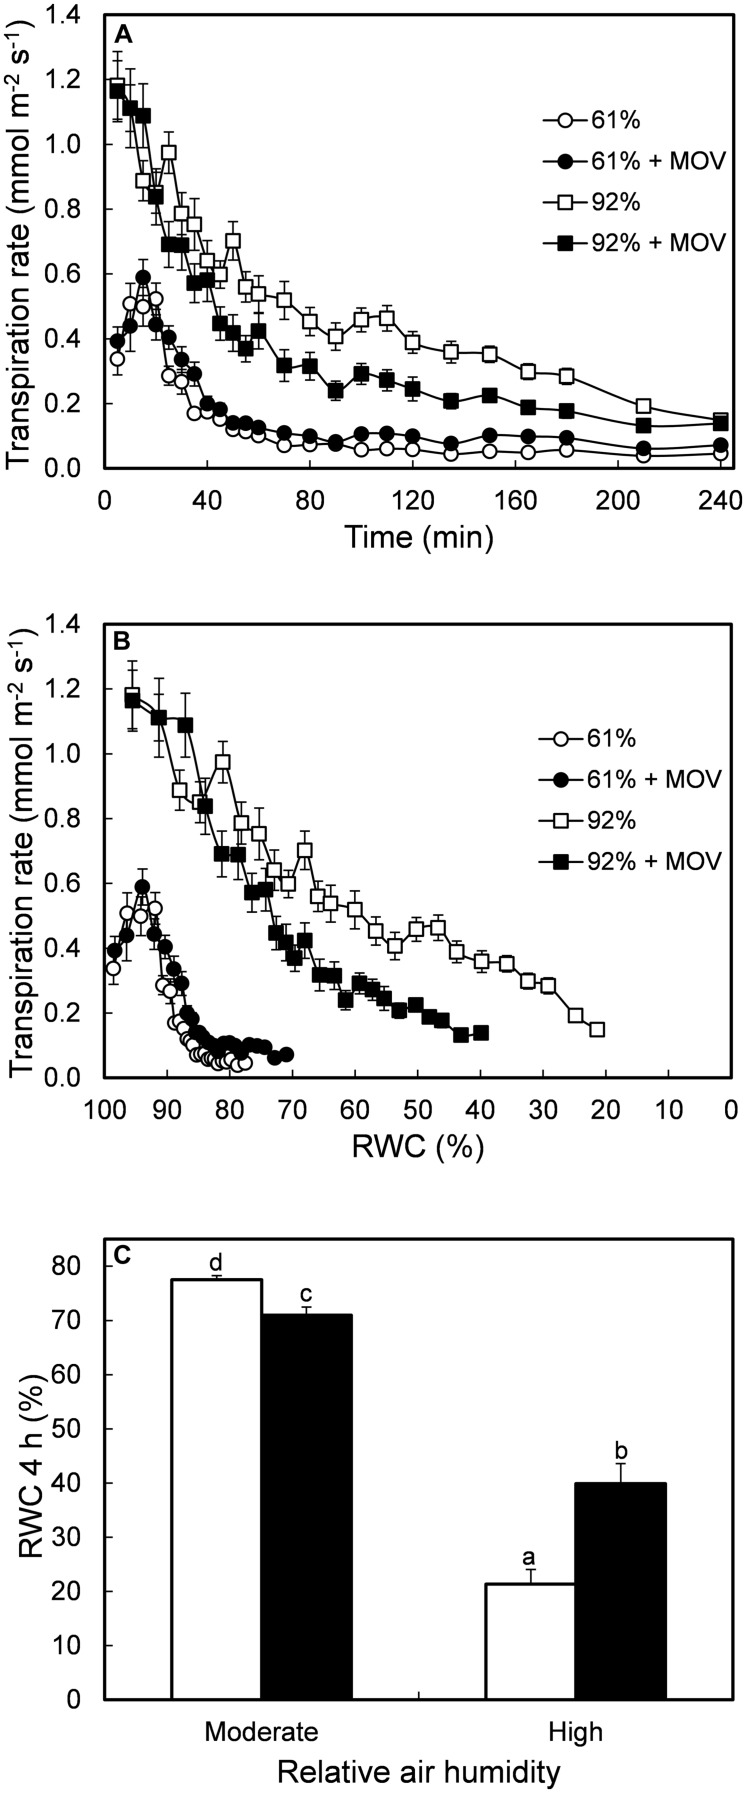
FIGURE 2.
Transpiration rate as a function of time of desiccation (A) and as a function of RWC (B) during 4 h of leaflet desiccation. RWC after 4 h of leaflet desiccation (C). All measurements were conducted in pot rose cv. ‘Toril’ grown at moderate (61%; circles) or high (92%; squares) RH, without (open symbols) or with (solid symbols) additional MOV. Values are the mean of 28 detached leaflets and bars represent SEM. Different letters indicate significant differences according to Fisher’s LSD test (P = 0.05).

