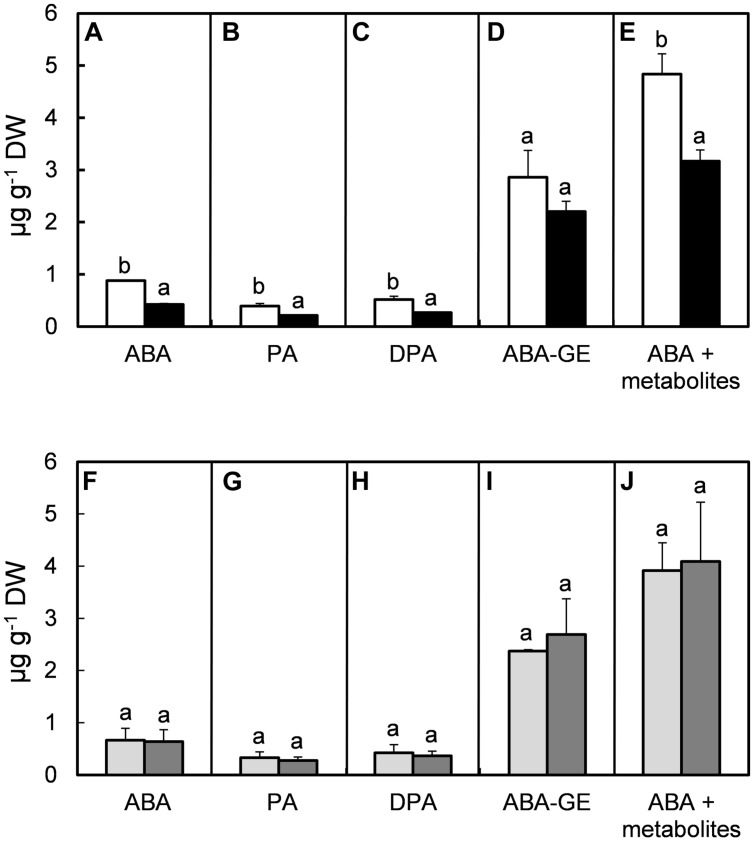
FIGURE 4.
Effect of moderate (61%; open columns) and high (92%; solid columns) RH (A–E), combined with no additional MOV (light gray columns) or with additional MOV (gray columns; F–J) on the levels (μg g-1 DW) of ABA (A,F), PA (B,G), DPA (C,H), ABA-GE (D,I) and total concentration of ABA and its metabolites (E,J) in leaves of rose plants cv. ‘Toril.’ Sampling occurred 5 h after the beginning of the light period. Each sample consisted of a composite of seven leaflets from seven biological replicates. Values are the mean of two biological repeats and bars represent the SEM. Different letters indicate significant differences according to Fisher’s LSD test (P = 0.05).

