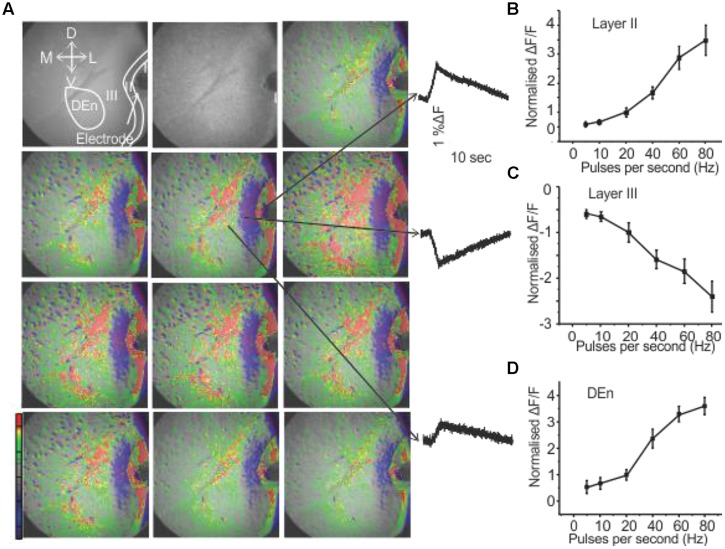
FIGURE 1.
Activation of PC involves three kinds of responses originating in different anatomical regions. (A) Show a 10 s long recording where a 80 Hz stimulation was used (red, green, yellow represents depolarization: blue, magenta, violet represent hyperpolarization). Waves on the right side indicated by arrows represent depolarization responses from Layer II and dorsal endopiriform nucleus (DEn) and a hyperpolarizing response from Layer III (arrows in the first panel represent the orientation of the slice. D: dorsal; V: ventral; M: medial; L: lateral). (B–D) Graphs of normalized change in ΔF/F vs. stimulus intensity from nine recordings in the Layers II, III and DEn respectively. Activation of each response increased over the range of stimulation of 20–80 Hz (γ-range).

