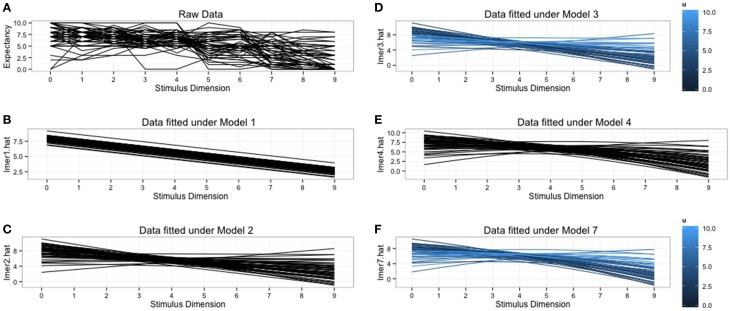
Figure 1.
Graphical representation of the raw data and the predicted data for the fitted models. (A) The raw data plot for all 52 subjects. (B) Subjects specific predictions under the random intercept model. (C) Subject specific predictions under random intercept, random slope model. Notice the differences in slope for every subject. (D) Subject specific predictions from the random intercept, random slope model with inclusion of individual differences variable, ui. The shades of blue indicate the scores on ui, the lighter shades generalize more. (E) Subject specific predictions under the quadratic model. (F) Predictions under the quadratic model with inclusion of individual differences variable, ui. The shades of blue indicate the scores on ui, lighter shades generalize more.

