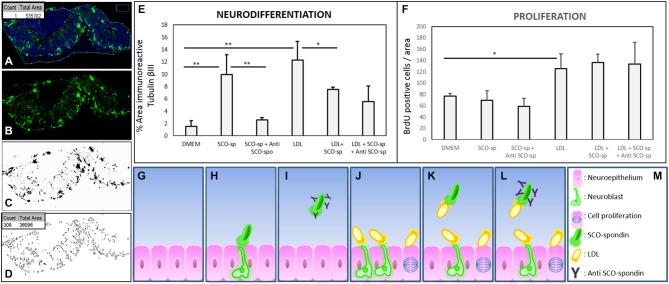
Figure 6.
Quantitative analysis of proliferation and neurodifferentiation in mesencephalic explants under various experimental conditions. (A–D) Steps performed to quantify cell proliferation and differentiation using the ImageJ program. (A) The explants were enclosed and the total area measured (box in A). (B–C) The image of the immunostained explant (without TOPRO-3) was transformed to a binary image. (D) The total number of particles from the binary image were measured (count in box D), and the area occupied by these particles was summarized (total area in box D). When the analyzed figure was immunostained with anti-BrdU, the count represented the number of positive nuclei. When the analyzed figure was immunostained with anti-tubulin βIII, the total area represented the magnitude of neurodifferentiation. (E) Quantitative analysis of neuroepithelial cells undergoing neural differentiation, as measured by the % of area positive for tubulin βIII. (F) Quantitative analysis of cell proliferation was measured by the number of BrdU-positive cells per area. (G–M) Scheme showing the interpretation of proliferation and neurodifferentiation analyses. The results showed that SCO-spondin by itself was able to promote the neurodifferentiation of neuroepithelial cells (E,H), but this capacity drastically diminished in presence of anti-SCO-spondin (E,I) or LDL (E,K). On the other hand, LDL by itself was able to promote neurodifferentiation (E,J) and proliferation (F,J). The proliferation generated by LDL was independent of the presence of SCO-spondin and anti-SCO-spondin, but, rather, neurodifferentiation decayed in the presence of SCO-spondin (with or without anti-SCO-spondin), suggesting that the LDL-SCO-spondin complex is unable to promote neurodifferentiation. Statistical analyses were performed using the Student’s t test, *p < 0.05; **p < 0.01. Bars represent the mean ± SEM of three experiments.

