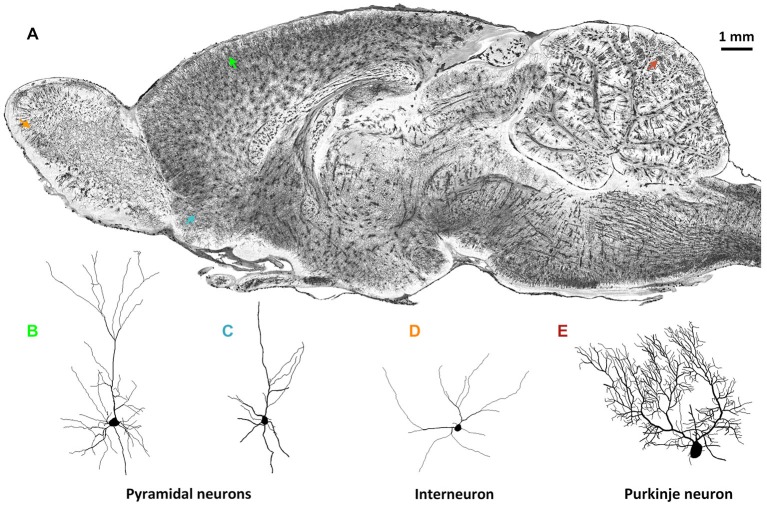
Figure 1.
Whole-brain imaging of rat neuronal morphology with Golgi staining (Vbn, 2015). (A) A sagittal image of a 200 μm thickness projection from a whole-brain imaging dataset acquired by MOST method (Li et al., 2010). Arrowheads in different colors in (A) indicate individual neurons. (B) Pyramidal neuron in somato motor cortex (green in (A)); (C) Pyramidal neuron in anterior olfactory nucleus of olfactory bulb (blue); (D) Interneuron in glomerular layer of olfactory bulb (orange); (E) Purkinje cell in cerebellum (brown).

