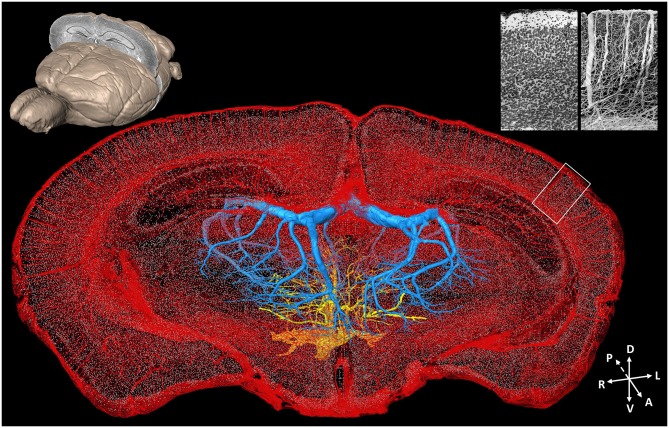
Figure 4.
Whole-brain cytoarchitecture and vascular networks acquired by the MOST method. A 3D reconstruction of the mouse brain is in the top left corner; the selected 300 μm slab at the coronal plane presents the spatial location of the data at the center. The center shows the cytoarchitecture and vascular network, simultaneously acquired in the brain. Blue and yellow represents the branches of the longitudinal hippocampal vein and some thalamo-perforating arteries in thalamus, respectively, red represents all else vessels in this data set, and gray dots represent the center of somas. The enlarged views of the cytoarchitecture and vascular architecture of the white rectangle in cortical region in the data at the center are in the top right corner. Redrawn from the imaging dataset published in Wu et al. (2014).

