Figure 6.
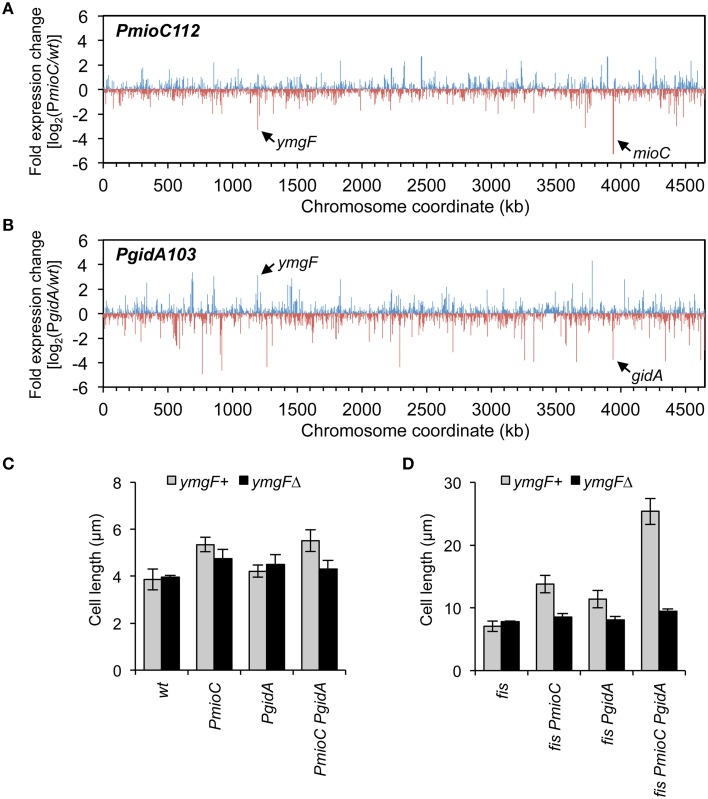
Transcription profiling in mioC and gidA mutants. (A,B) Changes in gene expression across the E. coli genome in mioC (A) and gidA (B) promoter mutants relative to wildtype was determined by RNA sequencing (Materials and Methods). Blue and red ticks indicated positive or negative fold-changes of individual genes. The positions of mioC and gidA, and a strongly affected cell division gene, ymgF, are indicated. See Table S3 for description of other affected genes. (C,D) The cell elongation phenotype of gidA and mioC mutants requires YmgF. Cell length was measured in exponentially growing wildtype and mioC and gidA promoter mutants in fis+ (C) or fis− (D) genetic background, in the presence (black bars) or absence (gray bars) of a ymgFΔ mutation.

