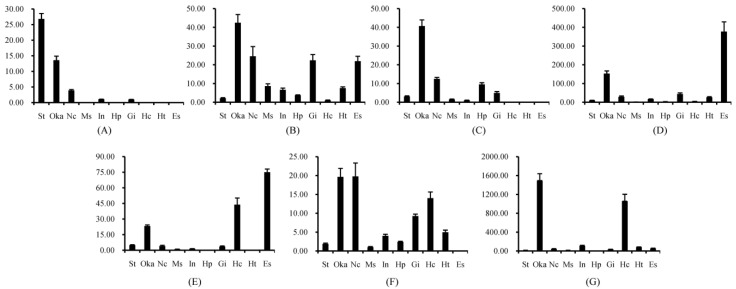
Figure 1.
The tissue distribution of different FcALFs transcripts. FcALF1, FcLAF2, FcLAF3, FcLAF4, FcLAF5, FcLAF6 and ALFFc were shown in (A–G), respectively. St, Stomach; oka, lymphoid organ; Nc, nerve cord; Ms, muscle; In, intestine; Hp, hepatopancreas; Gi, gill; Hc, haemocytes; He, heart; Es, eyestalk. Vertical bars represented the mean ± standard error (SE) (n = 10).

