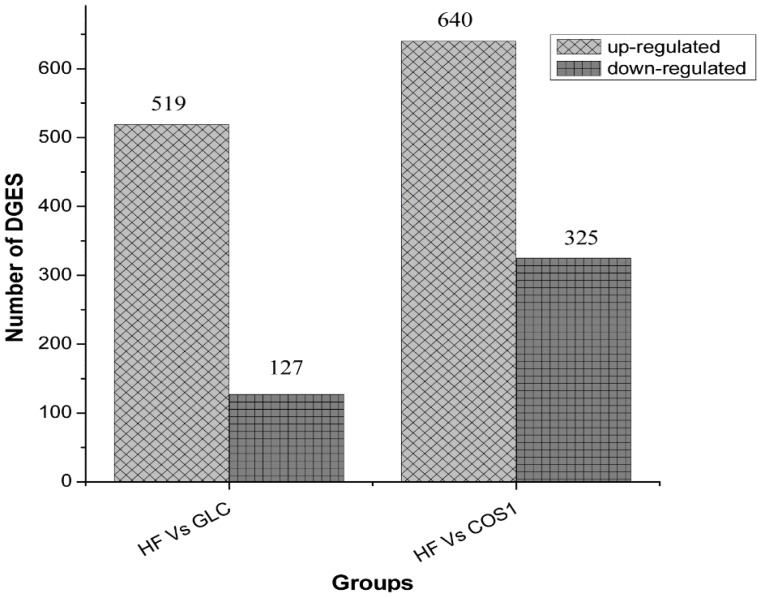
Figure 9.
The Statistics of differentially expressed genes. Compared with the HF group, five hundred nineteen genes were up-regulated, while 127 were down-regulated in the GLC group. When COS1 group compared with the HF group, there were six hundred forty genes up-regulated and three hundred twenty five genes down-regulated.

