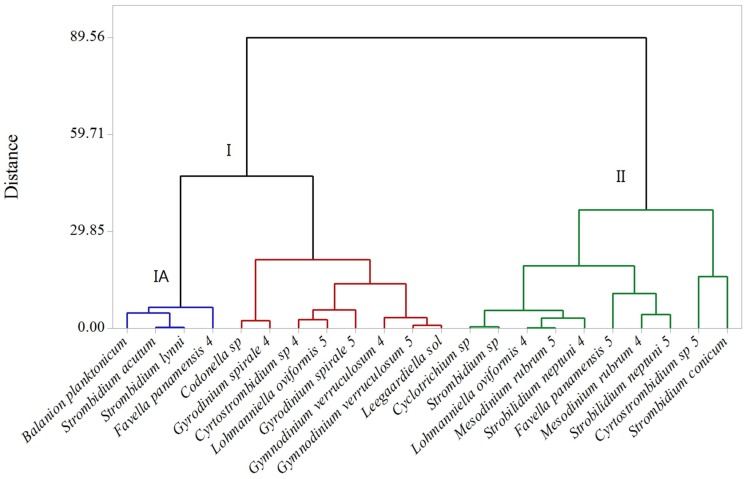
Figure 5.
The results of cluster analysis of microzooplankton species-specific response to PUA in Exp. 4 and 5 expressed as the ratio of microzooplankton T24 abundance at each PUA concentration to that in control. Cluster I includes the species that responded negatively to PUA; Sub-cluster IA includes the species that increased in the low PUA treatment and declined in the medium and high treatments. Cluster II includes the species with a weak response, visible only at the high PUA concentration or no response at all. The numbers next to the species name refer to the experiment where these species occurred (see Table 2). Ward linkage and Pearson squared distance were used to build the cluster tree.

