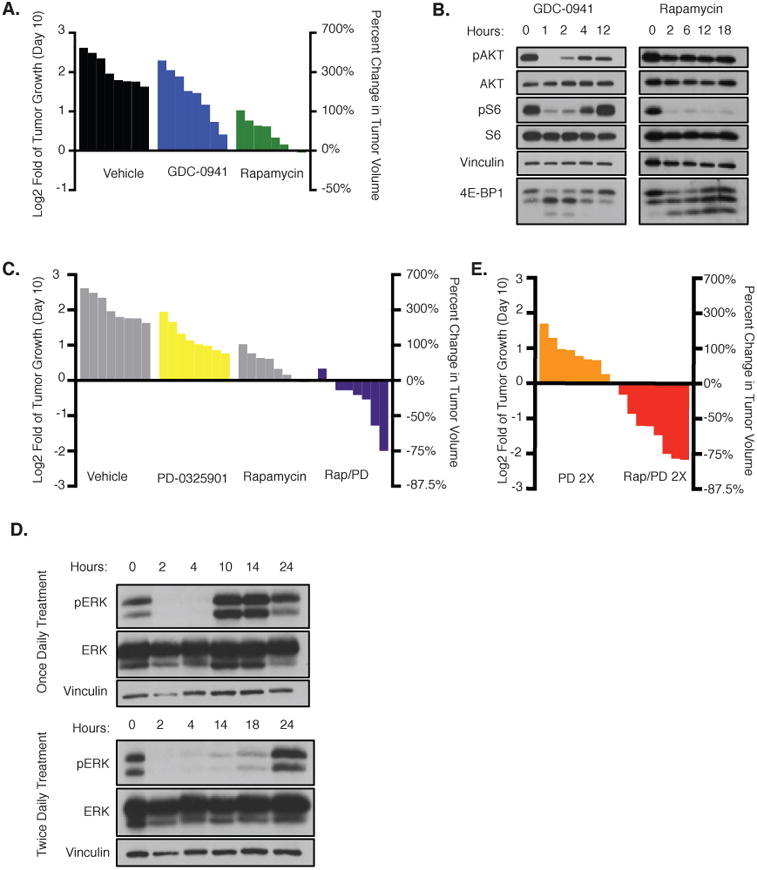
Figure 2. Therapeutic effects of PI3K and MEK pathway inhibitors in vivo.

A, Waterfall plot depicting change in tumor volume in NPcis mice after 10 days of treatment with vehicle (black), GDC-0941 (blue), or rapamycin (green). The left y-axis indicates the log2 of the fold change in volume after 10 days. The right y-axis indicates the percent change in tumor volume relative to day 0. B, pAKT/pS6/4E-BP1 immunoblots of tissue from animals exposed to GDC-0941 or rapamycin for the indicated amount of time. AKT, S6, and vinculin serve as controls. C, Waterfall plot depicting change in tumor volume after 10 days of treatment with PD-0325901 (yellow) or rapamycin and PD-0325901 (Rap–PD) in combination (purple). Vehicle and rapamycin (gray) are reprinted from A for reference. The left y-axis indicates the log2 of the fold change in volume after 10 days. The right y-axis indicates the percent change in tumor volume relative to day 0. D, Immunoblots showing pERK levels in tissue after treatment with PD-0325901 once daily (top) or twice daily (bottom). Hours, number of hours from initial treatment. Representative samples from three biologic replicates are shown. Vinculin and ERK serve as controls. E, Waterfall plot depicting change in tumor volume after 10 days of treatment with PD-0325901 twice daily or PD-0325901 twice daily in combination with rapamycin. The left y-axis indicates the log2 of the fold change in tumor volume relative to day 0 and the right y-axis indicates the percent change in tumor volume.
