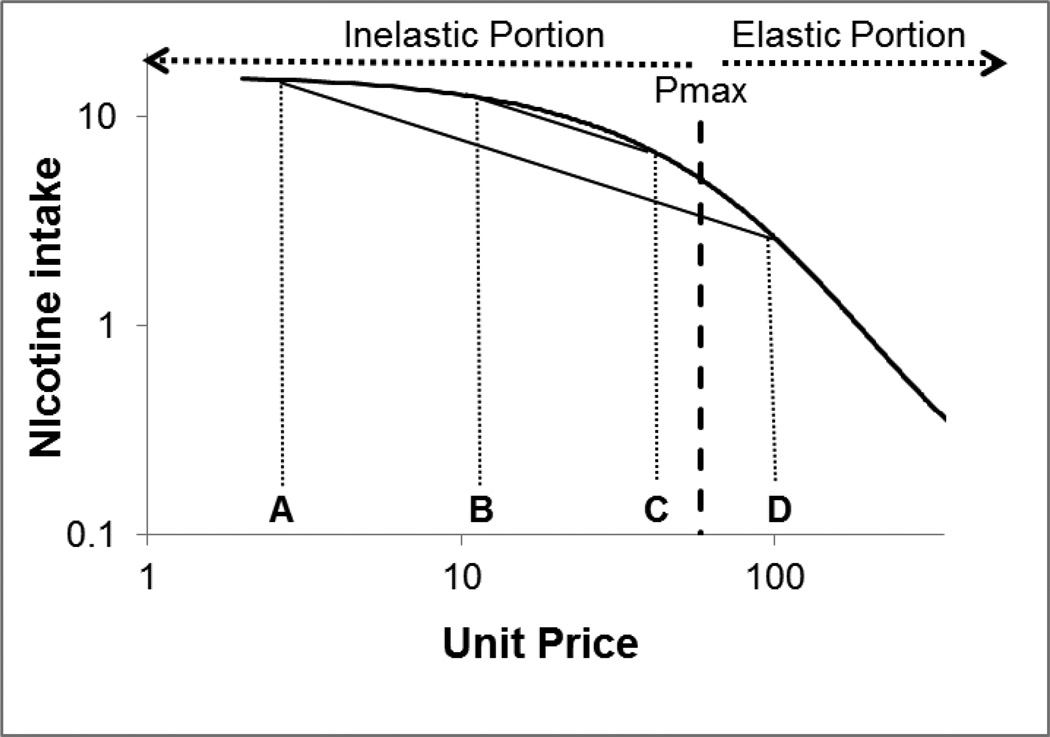
Figure 2.
Hypothetical demand curve plotting nicotine consumption as a function of unit price. If changes in nicotine consumption were calculated using the traditional compensation index (CI, see text), CI would be the same between unit prices A and D as between unit prices B and C. However, the demand curve shows that the change from unit price A to unit price D has shifted demand to the elastic portion of the curve, and further increases in unit price will reduce behavior. The change from unit price B to unit price C has shifted demand close to Pmax, where the maximal behavioral output will be observed.

