
Figure 3.
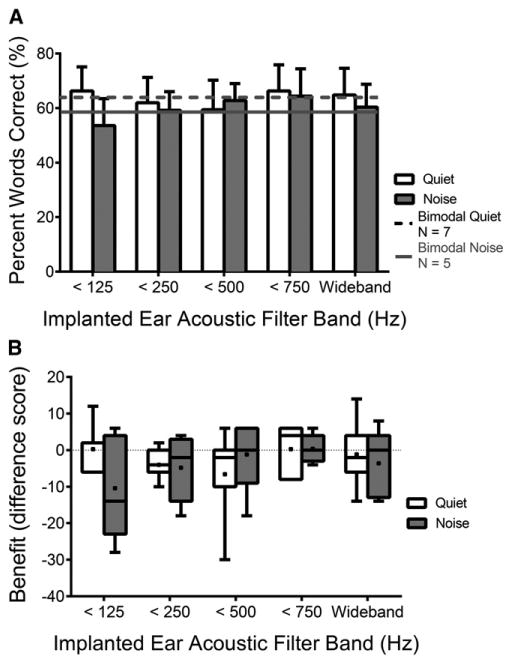
Mean EASall performance with each filter band is displayed for quiet and multitalker babble as unfilled and gray-filled bars, respectively (A). Mean bimodal performances in quiet and in noise are represented by the dotted-black and solid-gray lines, respectively. Error bars represent 1 standard error of the mean. Individual and mean additional benefit of the acoustic hearing in the implanted ear (EASall – bimodal for each filter band in the implanted ear) are shown using unfilled and gray-filled box plots for quiet and multitalker babble, respectively (B). Box plots in B include horizontal lines at the median values and “+” signs at the mean values, with the whiskers representing the minimal and maximal benefit values. Horizontal dotted lines in B and D represent no benefit or change in performance with added acoustic hearing. N = 7 in quiet and N = 5 in multitalker babble.