
Figure 4.
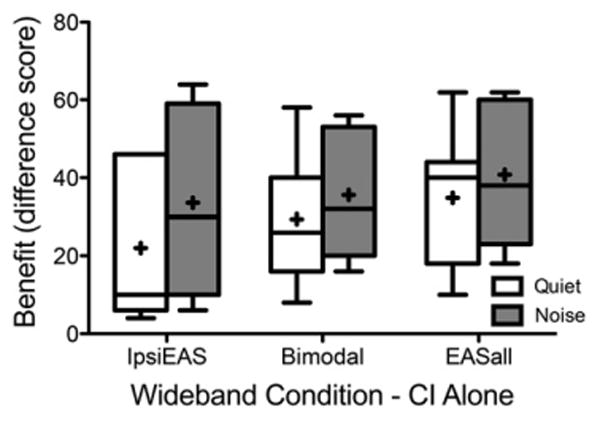
Individual and mean acoustic benefit for the wideband filters of IpsiEAS, bimodal, and EASall in unfilled box plots for testing in quiet and gray-filled box plots for testing in multitalker babble. Box plots include horizontal lines at the median values and “+” signs at the mean values, with the whiskers representing the minimal and maximal benefit values. N = 7 in quiet and N = 5 in multitalker babble.