Figure 2.
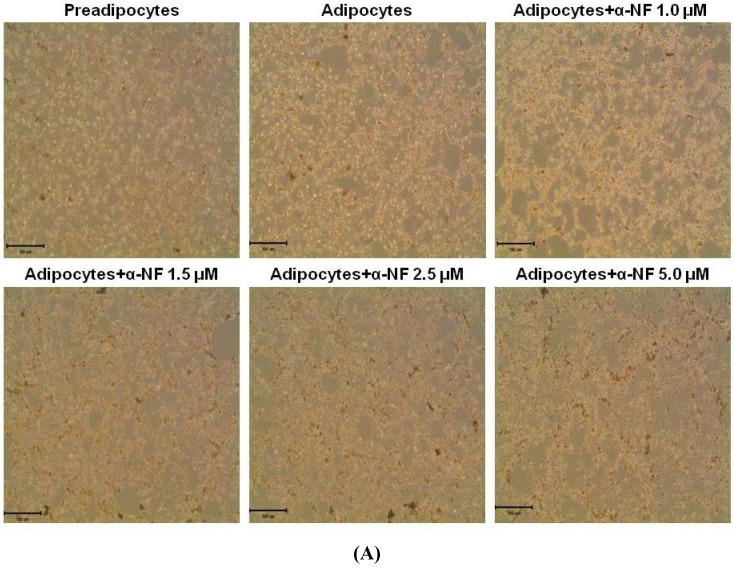
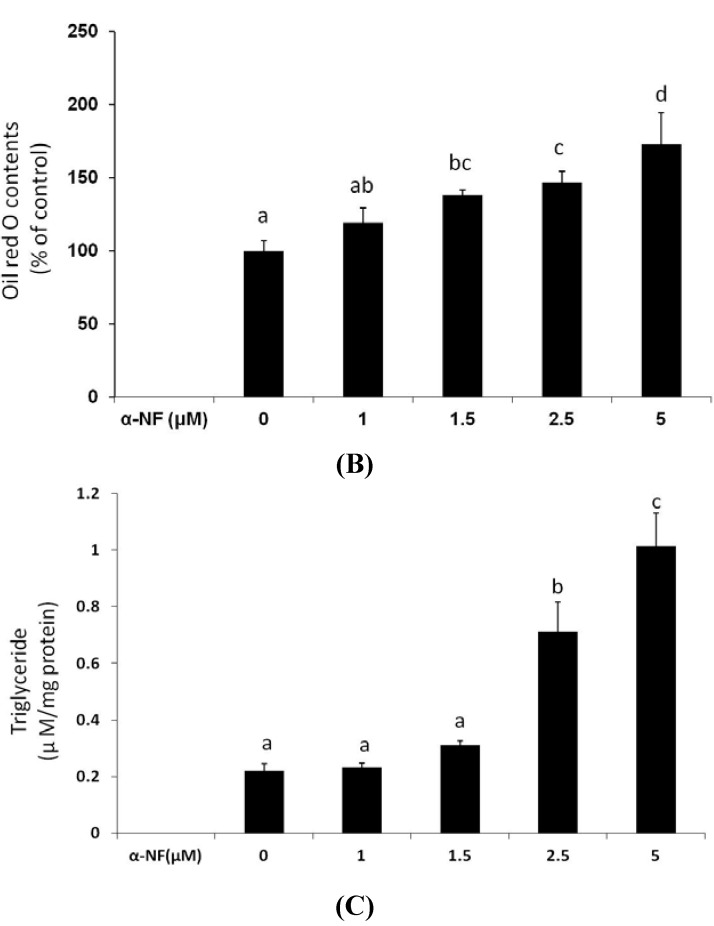
Effect of α-naphthoflavone (α-NF) on lipid accumulation in differentiated adipocytes. Cells were treated with various concentrations of α-NF for 16 h. Intracellular lipid accumulation was observed by oil-red-O staining (100× magnification) (A) and quantified (B) by the method described in “Materials and Methods”. Triglyceride (TG) contents (C) were quantified with a commercial kit. Pictures are representative of three independent experiments. Values are the mean ± SD from three measurements. Data with different letters significantly differ (p < 0.05).


