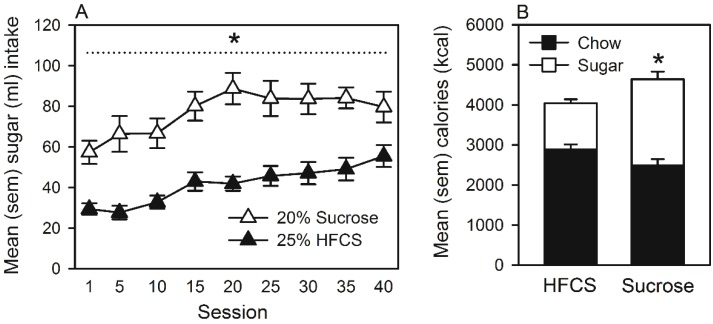
Figure 6.
(A) Mean (SEM) sugar (mL) intake by rats that self-administered 25% HFCS or 20% sucrose in their home cages. * Significant difference between groups. (B) Mean (SEM) total calories (kcal) consumed by rats. The proportions of calories derived from chow and sugar consumption are represented by the black and white stacked bars, respectively. * Significant difference in total caloric intake between the 25% HFCS and 20% sucrose groups.

