Figure 6.
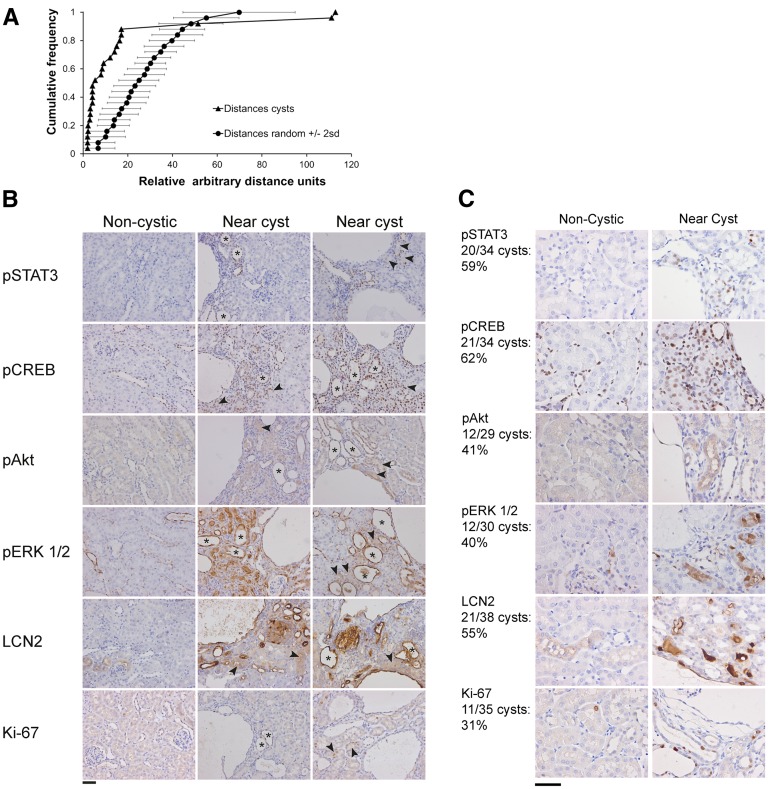
Clustered cyst formation and altered signaling near cysts. (A) Nearest neighbor analysis of a kidney section from a low-dose tamoxifen-treated iKsp-Pkd1del,lox mouse with unilateral nephrectomy and DCVC treatments euthanized 6 months after tamoxifen treatment (hematoxylin and eosin image is shown in Figure 3C). The graph depicts two plots. One plot is a cumulative plot generated from measurements of distances between nearest neighboring cysts (distances cysts), and one plot is an average of 20 simulations of similar types of cumulative plots generated from nearest distances of an equal number of points that were randomly distributed over an equally sized area (distances random). Horizontal error bars indicate 2 SDs of the random simulations. Note that the plot of the measured distances between nearest neighboring cysts is located at the left of the random simulations, indicating a relatively high number of short distances typical for a clustered distribution. (B) Images of renal sections from this mouse were immunostained using antibodies specific for pSTAT3, pCREB, pAKT, pERK1/2, LCN2, and Ki-67. Regions without cysts have low expression of these proteins and show normal renal histology (left panel, noncystic). Regions with cysts have increased expression of these proteins (center and right panels, near cyst). Note that many tubules near cysts are dilated and have high expression of these proteins (examples indicated by asterisks). Also, many normal-appearing tubules near cysts have increased expression (examples indicated by arrowheads). Scale bar, 50 μm. (C) Renal sections at different locations of the kidneys from seven other mildly affected mice (i.e., containing only one or a few cysts per renal section) showed a similar staining pattern in and around 31%–62% of the cysts/clusters. The numbers are indicated at the left of C. Scale bar, 50 μm.

