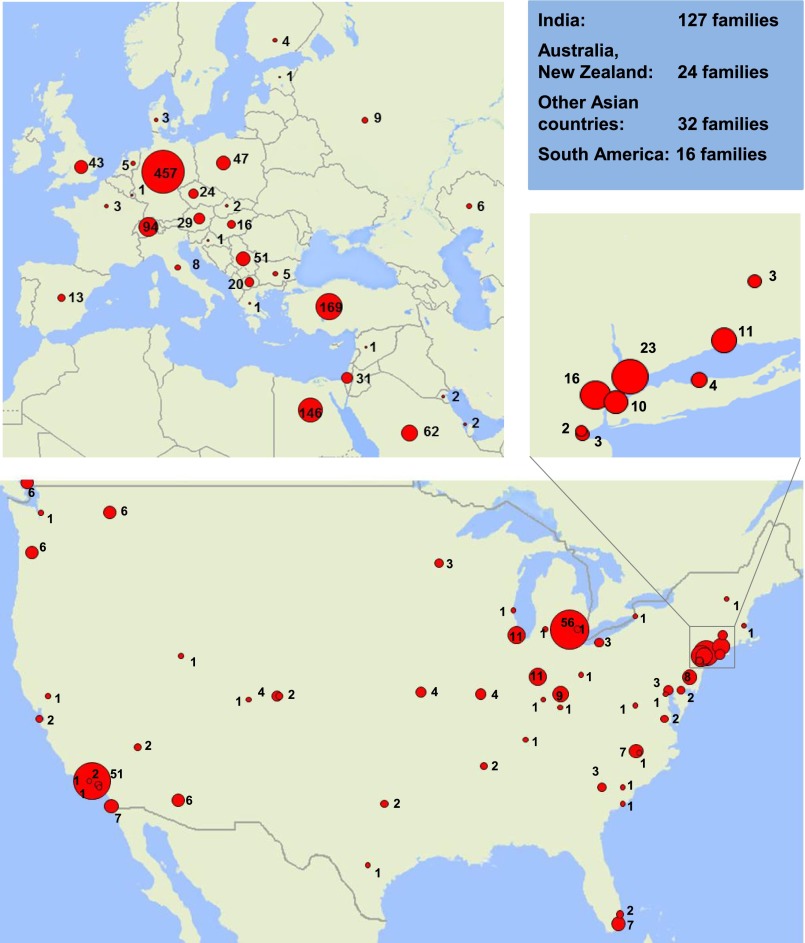
Figure 1.
Geographic distribution of the study cohort of 1783 families with SRNS. The number of affected families in the respective countries or cities is represented by the surface area (red) of a circle. Data from countries not represented on the map are shown in the blue box. Insert shows higher resolution of the New York Metropolitan area.

