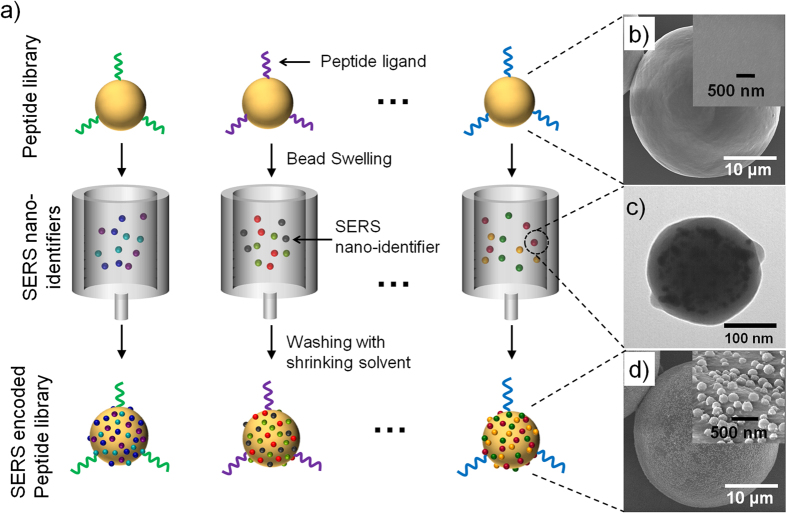
Figure 1.
Schematic diagram of the peptide-encoding process with SERS nano-identifiers (SERS IDs) and electron microscopic images at each step. a) Peptide-encoding process by attaching SERS IDs. b) Field-emission scanning electron microscope (FE-SEM) images of TentaGel (TG) microbeads without encoding (inset: High-magnification image of TG bead surface). c) Transmission electron microscope image of SERS ID, consisted of Ag NPs embedded in silica nanosphere. d) FE-SEM images of TG beads with SERS encoding (inset: High-magnification image of polymer bead surface bearing SERS IDs).

