Figure 2.

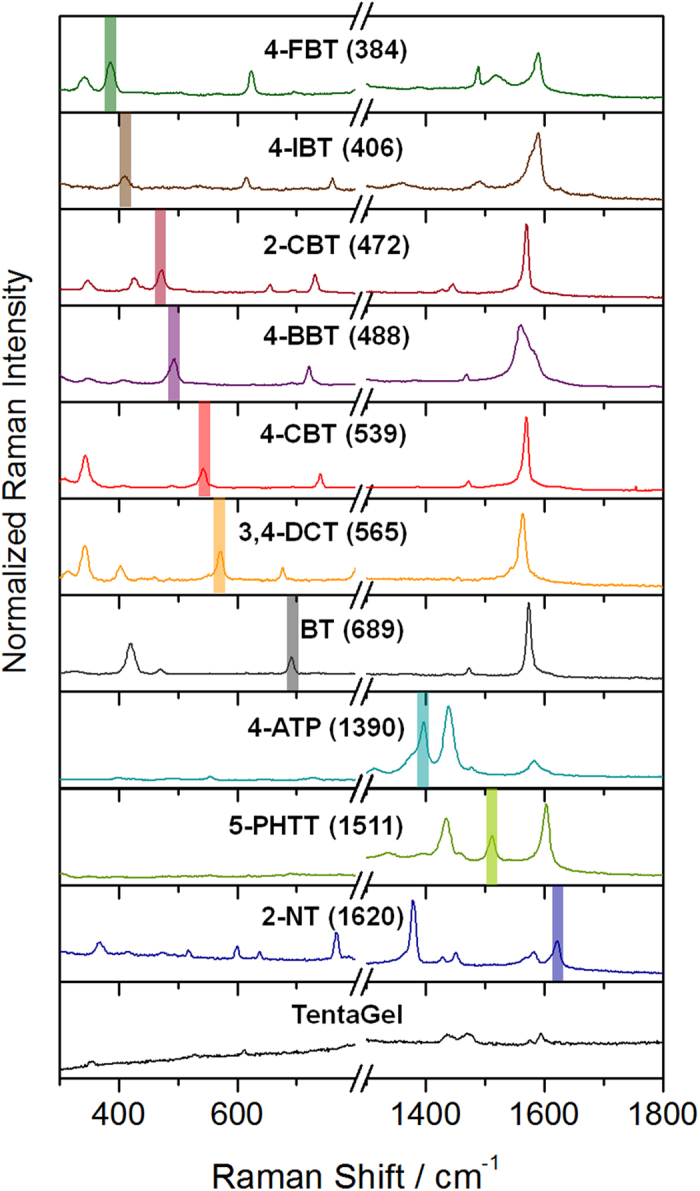
SERS spectra of SERS nano-identifiers (SERS IDs) and TentaGel microbeads. Colored bars indicate representative peaks without spectral overlap.

SERS spectra of SERS nano-identifiers (SERS IDs) and TentaGel microbeads. Colored bars indicate representative peaks without spectral overlap.