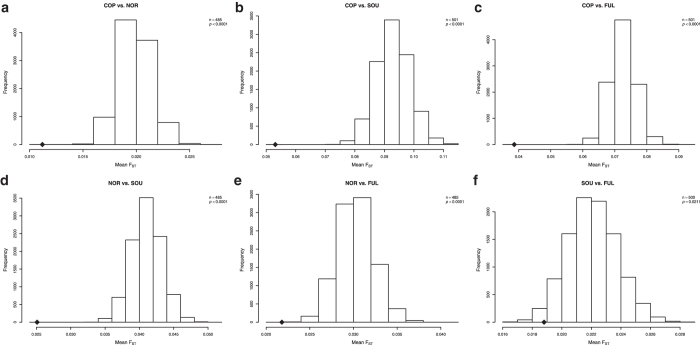
Figure 4. Genes associated with resistance/susceptibility to malaria.
Sampling distribution of the sample mean pairwise FST between populations. Average FST value of genes associated with resistance/susceptibility to malaria (♦) is significantly lower than the mean FST score of the sampling distribution in all pairwise comparisons. COP = Copts; NOR = Beja, Ethiopians, Arabs and Nubians; SOU = Darfurians, Nuba and Nilotes; FUL = Fulani. The sampling distribution is drawn from the mean FST value of subsets of randomly selected genic SNPs with a sample size equal to the number of common SNPs between populations in the selected genes (n) and with similar MAF (10,000 permutations).

