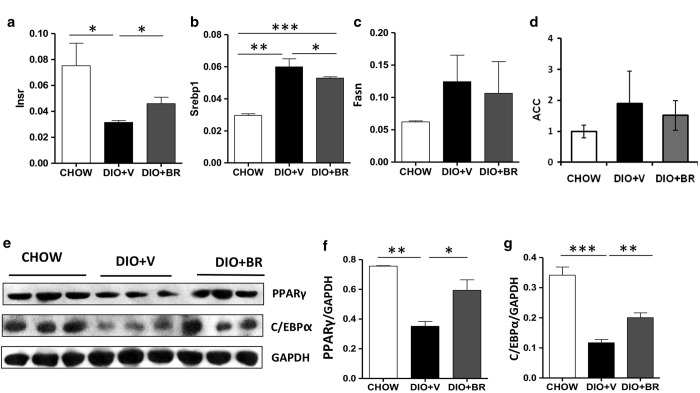
Figure 4. Bilirubin promotes expression of genes related to obesity and insulin resistance in liver 14 days post treatment.
Relative mRNA expression of insulin receptor (Insr) (a), SREBP-1 (b), Fasn (c) and ACC (d) in livers of DIO + BR, DIO + V, and CHOW mice as measured by RT-PCR analysis. Values represent relative expression of target gene compared to expression of endogenous control. (e) Expression of PPARγ and C/EBPα protein determined in liver from DIO + BR, DIO + V, and CHOW mice by Western blot analysis. Gels had been run under same experimental conditions and cropped blots are shown. (f) Relative protein expression of PPARγ and (g) C/EBPα relative to glyceraldehyde 3-phosphate dehydrogenase (GAPDH) control (NIH ImageJ software). Samples from 3 individual mice were analyzed. Data are mean ± standard deviation; ***p < 0.001, **p < 0.01 and *p < 0.05, Student’s t test.

