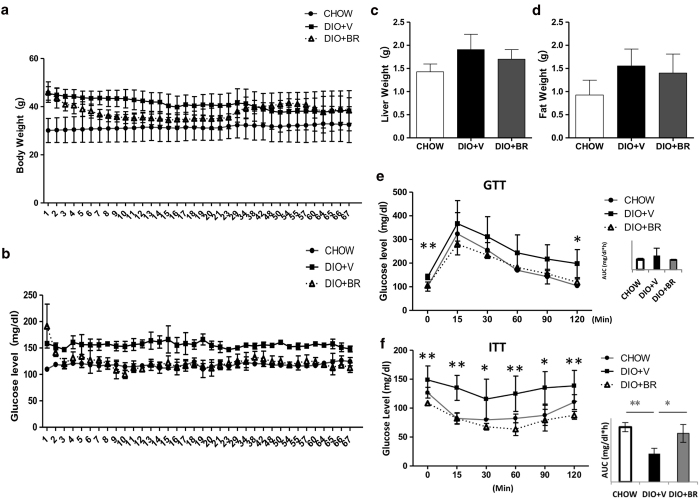
Figure 5. The insulin sensitizing effects of bilirubin persists 7 weeks after completion of bilirubin treatment.
(a) Body weight of DIO + BR, DIO + V, and CHOW mice during the 9-week experiment. (b) Serum glucose levels in DIO + BR, DIO + V, and CHOW mice during the 9-week experiment. Liver (c) and epididymal fat weights (d) measured 7 weeks after treatment completion. (e) (left) GTT of DIO mice measured 7 weeks after treatment completion; (right) values of area under the curve above baseline; (f) (left) ITT of DIO mice measured 7 weeks after treatment completion; (right) values of reverse area above the curve under baseline. At least 3 mice were included in each group. Data are mean ± standard deviation; ***p < 0.001, **p < 0.01, *p < 0.05, Student’s t test.

