
Fig. 1.
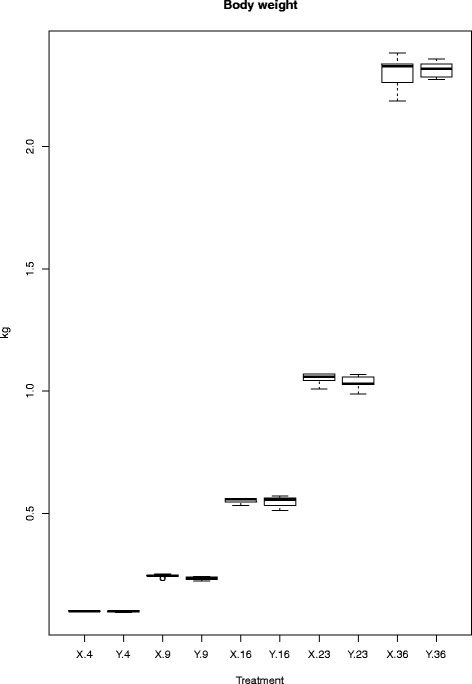
Boxplot of body weight in time for each chicken line. On the x-axis the lines X and Y and the days are depicted and the y-axis shows the body weight in kilograms. The letters X and Y stand for the chicken line and the numbers for the age in days