
Fig. 2.
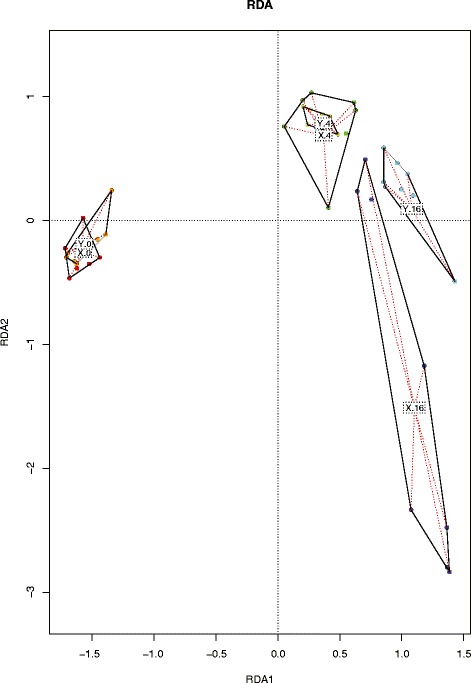
Redundancy analysis of jejunal microbiota composition (family level) on day 0, 4, and 16. Each symbol represents a pool of 10 chickens and represents their average microbiota composition. The data are represented as follows, for line X day 0 (red), day 4 (green), day 16 (blue) and for line Y day 0 (orange), day 4 (light green), day 16 (cyan)