
Fig. 3.
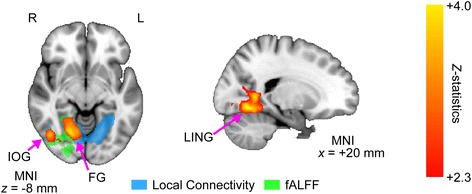
Spatial overlap of voxels showing alterations in local connectivity and fractional amplitude of low-frequency fluctuation in autism spectrum disorder (ASD). The z-map reflects the conjunction analysis between reduced local connectivity and reduced fractional amplitude of low-frequency fluctuation (fALFF). This analysis was performed using a cluster-wise test with z-stats threshold of 2.3 (corrected p threshold of 0.05). The red-yellow color indicates positive z-statistics (i.e., NC>ASD). In order to show the precise location of significant spatial overlap within the regions showing alterations of either measure, we overlaid the regions with disrupted local connectivity (shown in blue) and those showing reduced fALFF (shown in green) in the same axial slice. This analysis revealed substantial spatial overlaps between reductions in both local connectivity and fALFF. These significant spatial overlaps were observed in a large cluster (2047 voxels), which encompassed the right FG, LING, PCC, PHG, ITG, and pMTG. Right (R), left (L), fusiform gyrus (FG), lingual gyrus (LING), posterior cingulate cortex (PCC), parahippocampal gyrus (PHG), inferior occipital gyrus (IOG), inferior temporal gyrus (ITG), and posterior middle temporal gyrus (pMTG)