
Fig. 4.
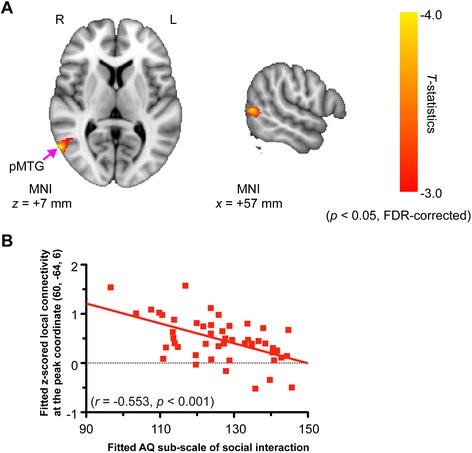
Significant negative correlations between disrupted local connectivity and the AQ subscale score of “social interaction”. A multiple linear regression analysis was performed in order to assess the relationship between disrupted local connectivity and the AQ “score of social interaction” subscale within the group of participants with autism spectrum disorder (ASD). a The multiple linear regression analysis revealed that the right pMTG showed a significant association between the AQ subscale score of “social interaction” and disrupted local connectivity. Of note, age and gender were included as nuisance covariates. Statistical significance was set at p < 0.05, with the false discovery rate (FDR) corrected for multiple comparisons. The red-yellow color indicates the negative t-statistics representing negative correlation between the AQ subscale of “social interaction” and local connectivity. b The relationship between disrupted local connectivity and the AQ subscale score of “social interaction” at the peak coordinate (MNI = [60, −64, 6]) was shown. For each participant with ASD, the local connectivity value was extracted from the peak coordinate and plotted against the “social interaction” score of that participant. Right (R), left (L), and posterior middle temporal gyrus (pMTG)