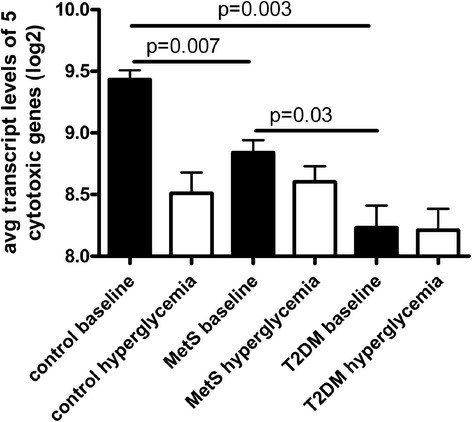
Fig. 4.

Visualization of the reduced expression of cytotoxicity related genes, in healthy controls after hyperglycemia (derived from Table 6). In patients with T2DM the expression is already low and does not further decrease after hyperglycemia. The average expression of 5 cytotoxicity related genes measured by microarray analysis is shown in controls (n = 3), MetS (n = 4) and T2DM (n = 6). Error bars indicate the standard error of the mean gene expression levels of the individuals within the groups. p-values are indicated for the comparisons between baseline levels, calculated by unpaired T-test
