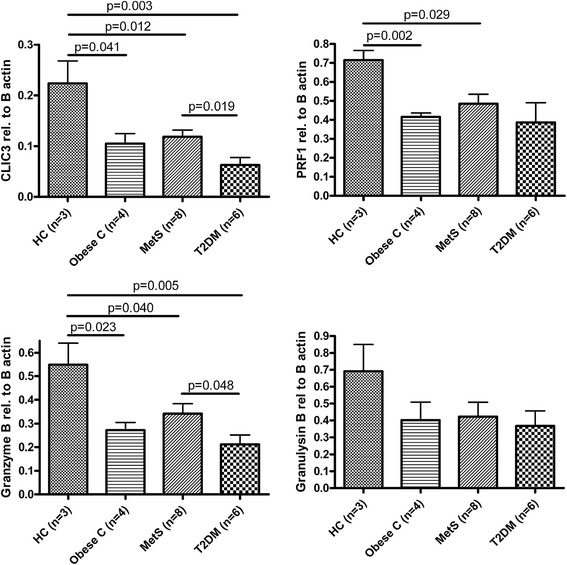
Fig. 5.

Baseline levels of cytotoxicity-related genes determined by real-time pcr in lean controls, obese controls, MetS and T2DM patients. mRNA levels of cytotoxicity genes are expressed relative to β-actin as indicated. Error bars indicate the standard error of the mean gene expression levels of the individuals within the groups. p-values are indicated for the comparisons between baseline levels, calculated by unpaired T-test
