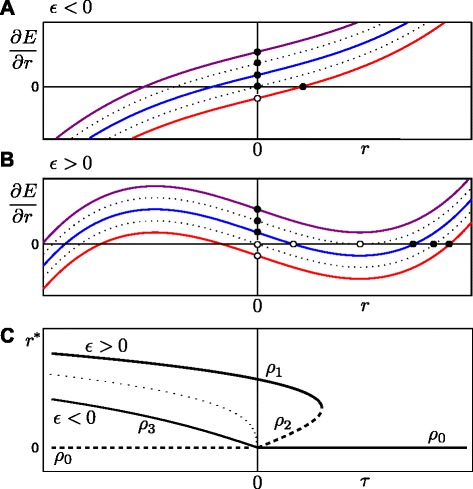
Figure 2.

Derivation of possible equilibrium cell sizes using the shape of the energy gradient function ∂ E/∂ r.(A) The energy gradient function ∂ E/∂ r for ε<0. The lower and upper dotted lines refer to τ=0 and , respectively. For τ<0 there is one stable positive equilibrium (red line), otherwise r ∗=0 is the only stable equilibrium (blue and purple lines). Stable equilibria are indicated by solid circles, unstable equilibria by open circles. (B) The energy gradient function ∂ E/∂ r for ε>0. The lower and upper dotted lines refer again to τ=0 and , respectively. For τ<0, only one stable equilibrium exists (red line). The interval defines the bistable region (blue line); when , r ∗=0 is the only stable equilibrium (purple line). The lines in (A) and (B) have the same parametrisation, except for ε, which has the opposite sign. (C) Bifurcation diagram showing the cell equilibria as a function of τ. Stable equilibria are indicated by solid lines, unstable equilibria by dashed lines. The solutions ρ 1, ρ 2 and ρ 3 are defined by Eq. 19, Eq. 20 and Eq. 21; whereas the trivial solution is defined by ρ 0=0.
