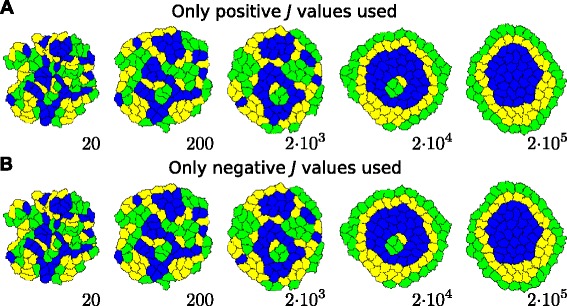
Figure 6.

One-to-one mapping between adhesion energy J and target perimeter P.(A) Simulation using positive J-values only, showing cell sorting of three different cell types, G(reen), Y(ellow), and B(lue), in a tissue surrounded by M(edium). Parameters used are J G,G=J Y,Y=J B,B=400, J G,M=600, J Y,M=1,200, J B,M=1,800, J G,Y=J Y,B=800, J G,B=1,400; A=30; P=67; λ a=1,000; λ p=20; and T=600. (B) Simulation using negative J-values only, presenting exactly the same dynamics as the simulation shown in (A). (Note that the same initial conditions and random seed were used.) Parameters are the same as in (A), except for J G,G=J Y,Y=J B,B=−3,200, J G,M=−1,200, J Y,M=−600, J B,M=0, J G,Y=J Y,B=−2,800, J G,B=−2,200; and P=22. Here, only the CPM parameters are given, which can be translated into the actual values using Eq. 31.
