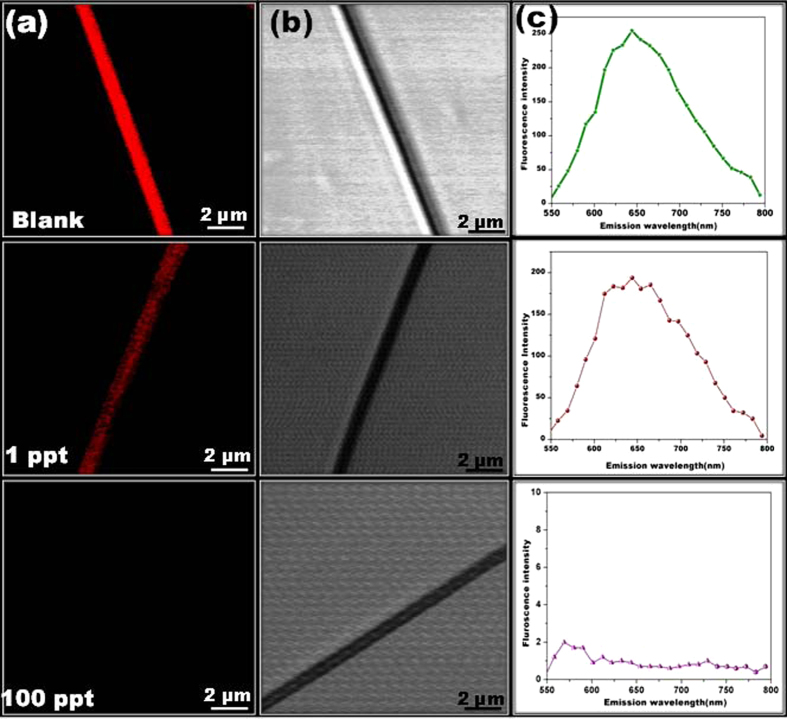
Figure 3.
(a) CLSM images of AuNC*PCL-SNF before and after addition of Hg2+ (100 ppt and 1 ppt) solution and their corresponding DIC image is presented in Figure. (b) The result shows that there is no change in their morphology and only the fluorescence feature of the NF changed according to the concentration. (c) The resultant fluorescence spectra collected from the surface of the NF.

